1992 Mauritanian presidential election
| |||||||||||||||||
| |||||||||||||||||
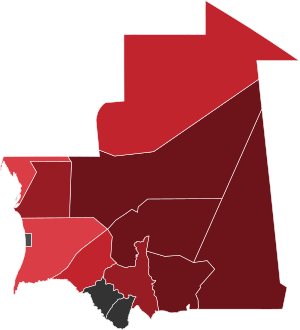
 Results by wilaya Taya: 40-50% 60-70% 70-80% 80%+ | |||||||||||||||||
| |||||||||||||||||
 |
|---|
|
|
|
|
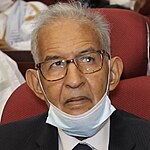
Presidential elections were held in Mauritania on 24 January 1992. They followed the constitutional referendum the previous year that resulted in the reintroduction of multi-party democracy, and were the first presidential elections to feature more than one candidate. The result was a victory for incumbent President Maaouya Ould Sid'Ahmed Taya of the Democratic and Social Republican Party, who defeated three other candidates with 62.9% of the vote.[1] Voter turnout was just 47.4%.[2]
Results[edit]
| Candidate | Party | Votes | % | |
|---|---|---|---|---|
| Maaouya Ould Sid'Ahmed Taya | Democratic and Social Republican Party | 345,583 | 62.89 | |
| Ahmed Ould Daddah | Union of Democratic Forces | 180,658 | 32.88 | |
| Mustafa Ould Salek | Independent | 15,735 | 2.86 | |
| Mohamed Mahmoud Ould Mah | Popular Social and Democratic Union | 7,506 | 1.37 | |
| Total | 549,482 | 100.00 | ||
| Valid votes | 549,482 | 97.98 | ||
| Invalid/blank votes | 11,314 | 2.02 | ||
| Total votes | 560,796 | 100.00 | ||
| Registered voters/turnout | 1,183,892 | 47.37 | ||
| Source: Nohlen et al. | ||||
By wilaya[edit]
| Wilaya | Ould Sid'Ahmed Taya |
Ould Daddah |
Ould Salek |
Ould Mah | ||||
|---|---|---|---|---|---|---|---|---|
| Votes | % | Votes | % | Votes | % | Votes | % | |
| Adrar | 17,182 | 85.0 | 1,787 | 8.8 | 1,003 | 5.0 | 228 | 1.1 |
| Assaba | 31,304 | 73.2 | 9,014 | 21.1 | 1,948 | 4.6 | 516 | 1.2 |
| Brakna | 30,248 | 61.4 | 17,443 | 35.4 | 1,001 | 2.0 | 556 | 1.1 |
| Dakhlet Nouadhibou | 17,092 | 49.7 | 15,356 | 44.7 | 1,320 | 3.8 | 606 | 1.8 |
| Gorgol | 16,179 | 48.0 | 16,888 | 50.0 | 360 | 1.0 | 348 | 1.0 |
| Guidimaka | 12,713 | 46.9 | 13,608 | 50.2 | 441 | 1.6 | 321 | 1.2 |
| Hodh Ech Chargui | 52,440 | 85.6 | 5,285 | 8.6 | 2,771 | 4.5 | 795 | 1.3 |
| Hodh El Gharbi | 54,342 | 84.4 | 7,507 | 11.7 | 1,903 | 3.0 | 618 | 1.0 |
| Inchiri | 2,926 | 72.7 | 823 | 20.4 | 168 | 4.2 | 109 | 2.7 |
| Nouakchott | 53,479 | 47.1 | 55,203 | 48.6 | 2,923 | 2.6 | 2,046 | 1.8 |
| Tagant | 18,089 | 81.7 | 3,407 | 15.4 | 425 | 1.9 | 233 | 1.1 |
| Tiris Zemmour | 7,506 | 64.2 | 3,598 | 30.8 | 460 | 3.9 | 127 | 1.1 |
| Trarza | 32,083 | 49.5 | 30,739 | 47.4 | 1,012 | 1.6 | 1,003 | 1.5 |
| Source: Nohlen et al. | ||||||||
References[edit]
- ^ Elections in Mauritania African Elections Database
- ^ Dieter Nohlen, Michael Krennerich & Bernhard Thibaut (1999) Elections in Africa: A data handbook, p596 ISBN 0-19-829645-2


