
Tropical Storm Carrie (1972)
 Satellite image of Tropical Storm Carrie near Massachusetts | |
| Meteorological history | |
|---|---|
| Formed | August 29, 1972 |
| Dissipated | September 5, 1972 |
| Tropical storm | |
| 1-minute sustained (SSHWS/NWS) | |
| Highest winds | 70 mph (110 km/h) |
| Lowest pressure | 993 mbar (hPa); 29.32 inHg |
| Overall effects | |
| Fatalities | 4 total |
| Damage | $1.78 million (1972 USD) (equivalent to $12.97 million in 2023) |
| Areas affected | U.S. East Coast, New England, New Brunswick |
| IBTrACS | |
Part of the 1972 Atlantic hurricane season | |
Tropical Storm Carrie was a strong tropical storm that affected the East Coast of the United States in early September 1972. The third tropical cyclone of the 1972 Atlantic hurricane season, Carrie formed on August 29 from a complex sequence of meteorological events starting with the emergence of a tropical wave into the Atlantic in the middle of August.
Tracking generally northward throughout its life, Carrie reached an initial peak intensity as a moderate tropical storm before nearly weakening back into tropical depression status. The storm began to intensify in a baroclinic environment after turning toward the northwest, its winds of 70,000 miles per hour (110,000 km/h) as it was transitioning into an extratropical system eclipsed the cyclone's previous maximum strength. The extratropical remnants of Carrie skirted eastern New England before making the landfall in Maine on September 4 and dissipating over the Gulf of Saint Lawrence during the next two days.
Carrie had a minimal impact on the East Coast south of New England, limited to increased swells, gusty winds, and light rainfall. The worst conditions occurred over southeastern New England, where wind gusts reached 84 mph (135 km/h) and rainfall exceeded 1 ft (300 mm). Damage was most severe along and slightly inland from the coast. Thousands of people became stranded on offshore islands of Massachusetts, after dangerous conditions created by the storm prompted the suspension of ferry service. Overall damage was generally light, with total monetary losses valued at $1,780,000 (equivalent to $12,970,000 in 2023), and four deaths are blamed on the storm.
Meteorological history[edit]

Tropical storm (39–73 mph, 63–118 km/h)
Category 1 (74–95 mph, 119–153 km/h)
Category 2 (96–110 mph, 154–177 km/h)
Category 3 (111–129 mph, 178–208 km/h)
Category 4 (130–156 mph, 209–251 km/h)
Category 5 (≥157 mph, ≥252 km/h)
Unknown
The origins of Tropical Storm Carrie are traced back to a tropical wave—an elongated area of low atmospheric air pressure that emerged from the western coast of Africa on August 15, 1972. A relatively strong weather system, the wave progressed westward, but by the time it had reached the Leeward Islands ten days later, it had degenerated substantially. The influence of a nearby upper-level low pressure system caused the disturbance to further deteriorate, and the resultant remnant circulation drifted toward the northwest; by August 28, it was situated at a position just offshore southeastern Florida.
The low pressure system maintained a cold core and had not yet established itself at the surface. On August 29, the low began moving northward in response to an approaching trough. For the first time, a low-level circulation center had been identified in association with the system,[1] and the storm became a tropical depression at 1200 UTC while located east of the central Florida peninsula.[2] The depression tracked steadily northeastward as it gradually intensified.[1]
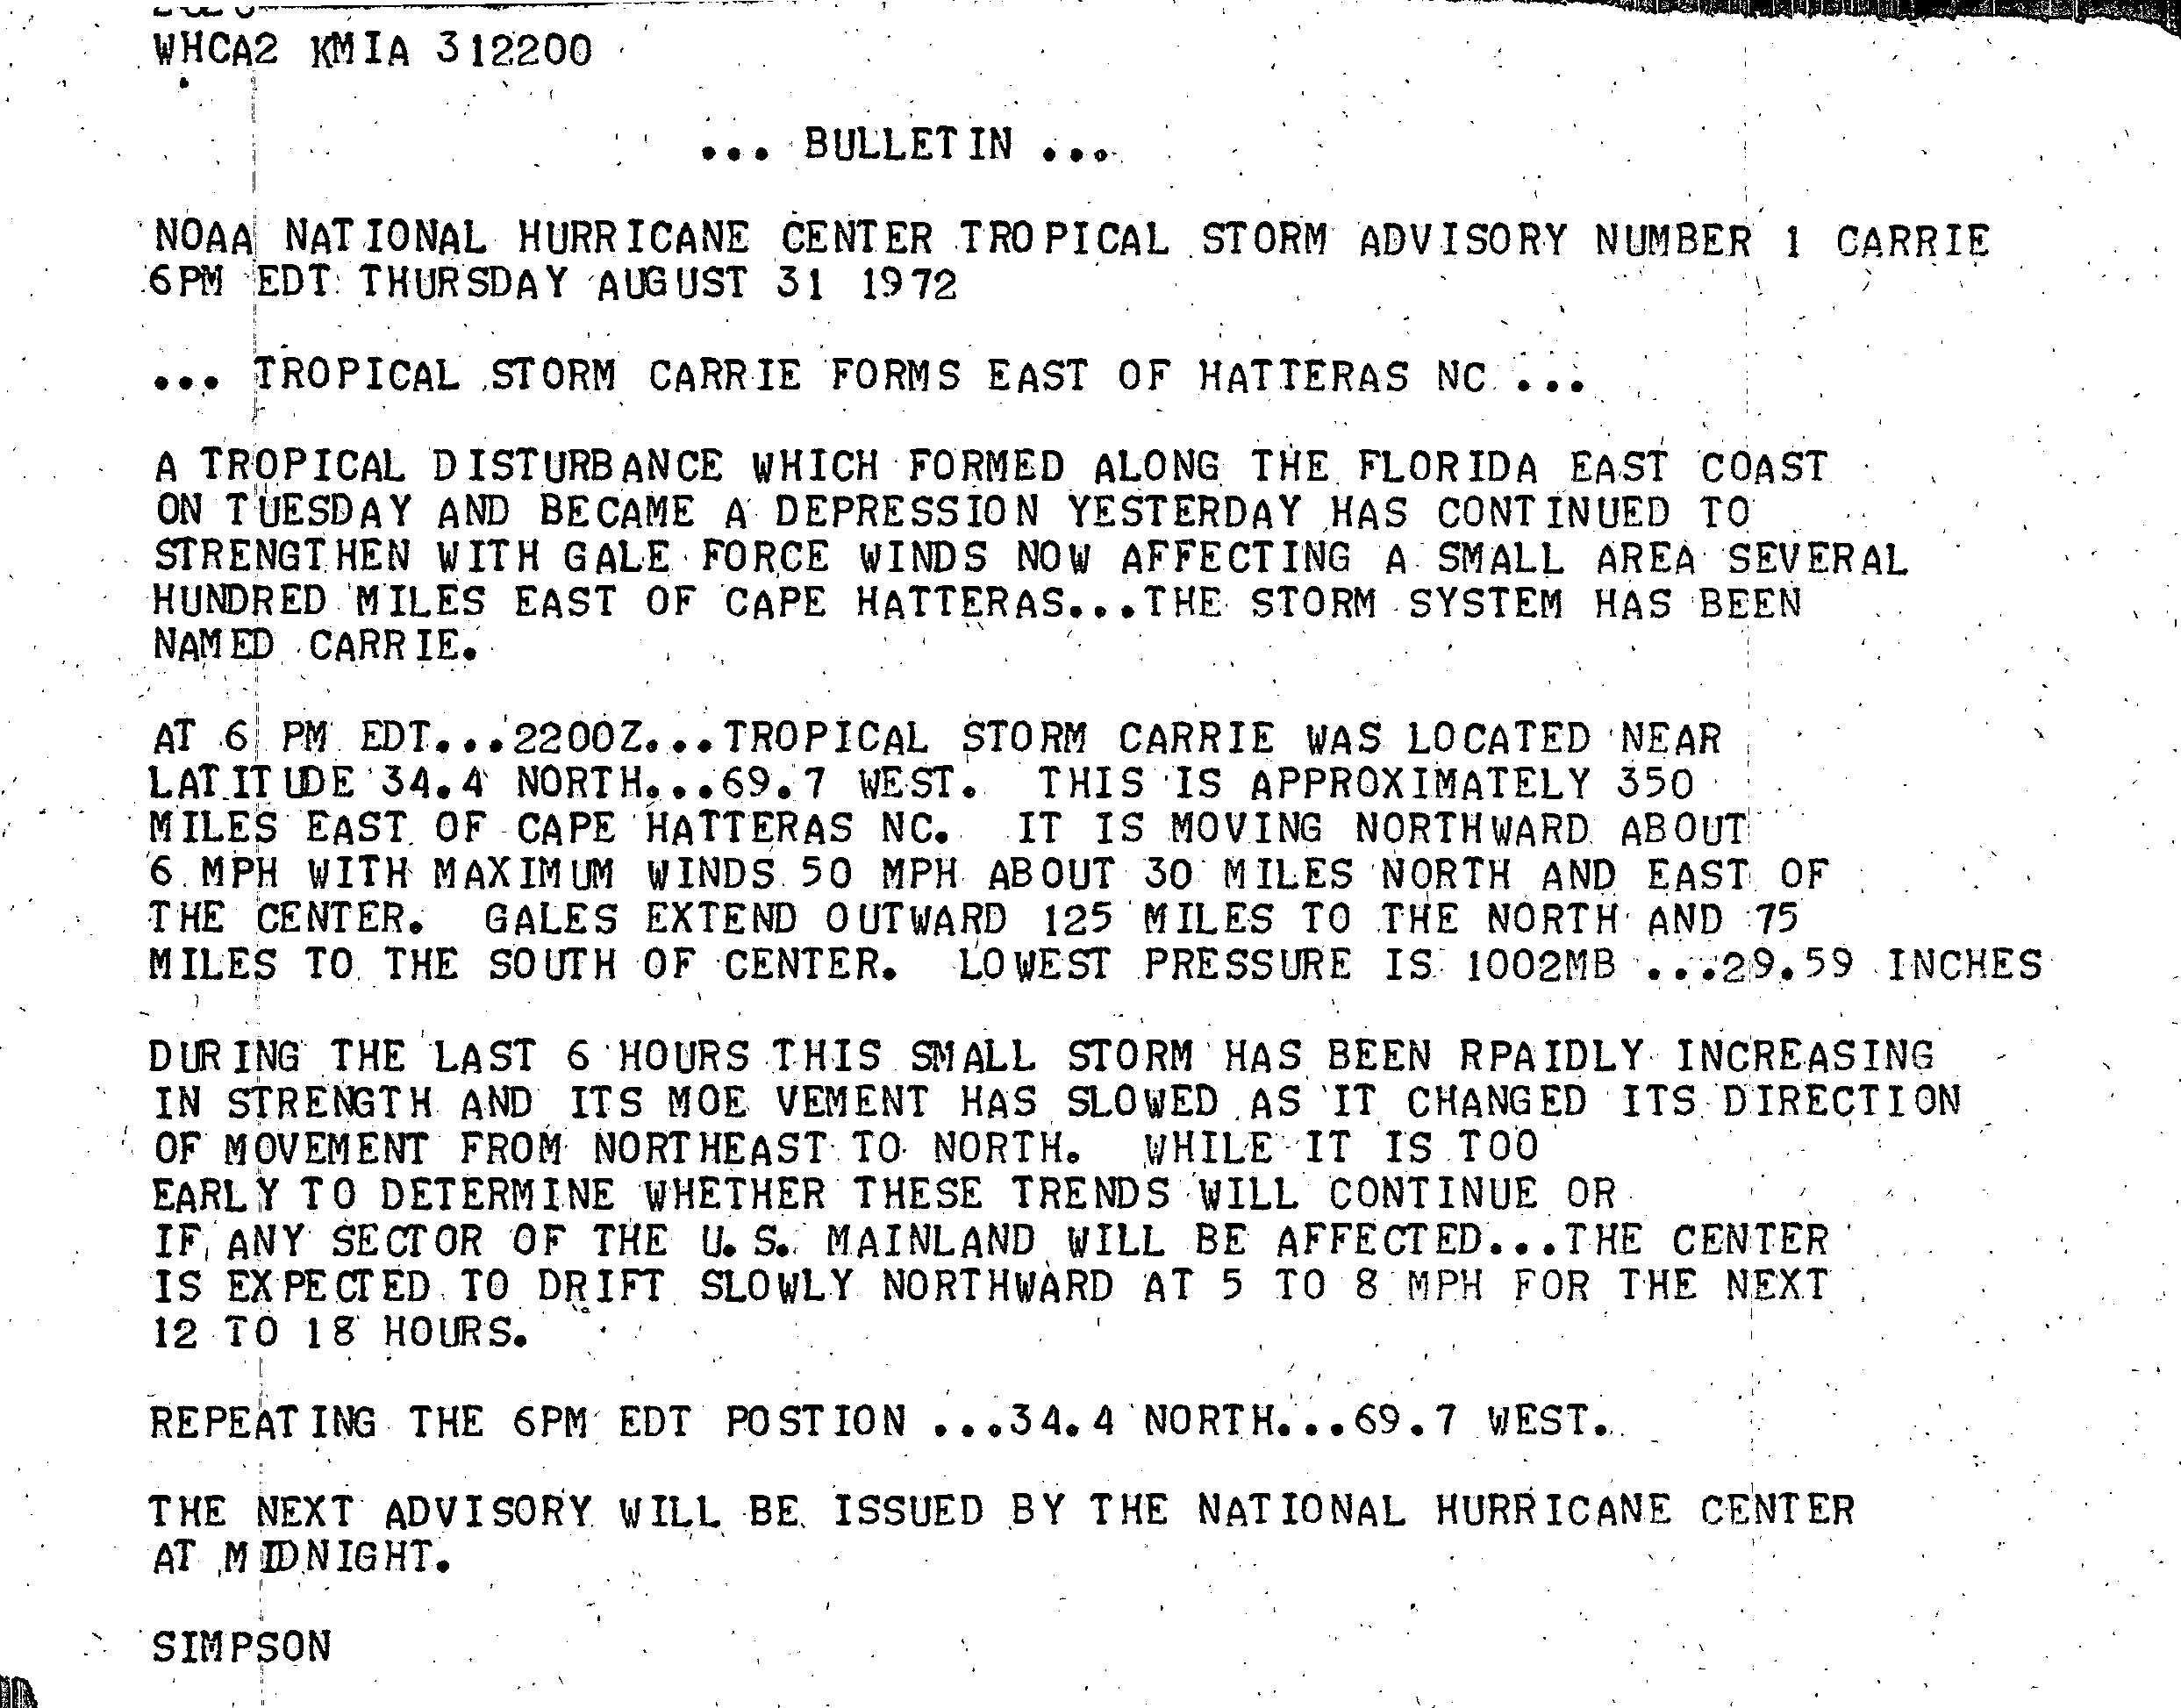
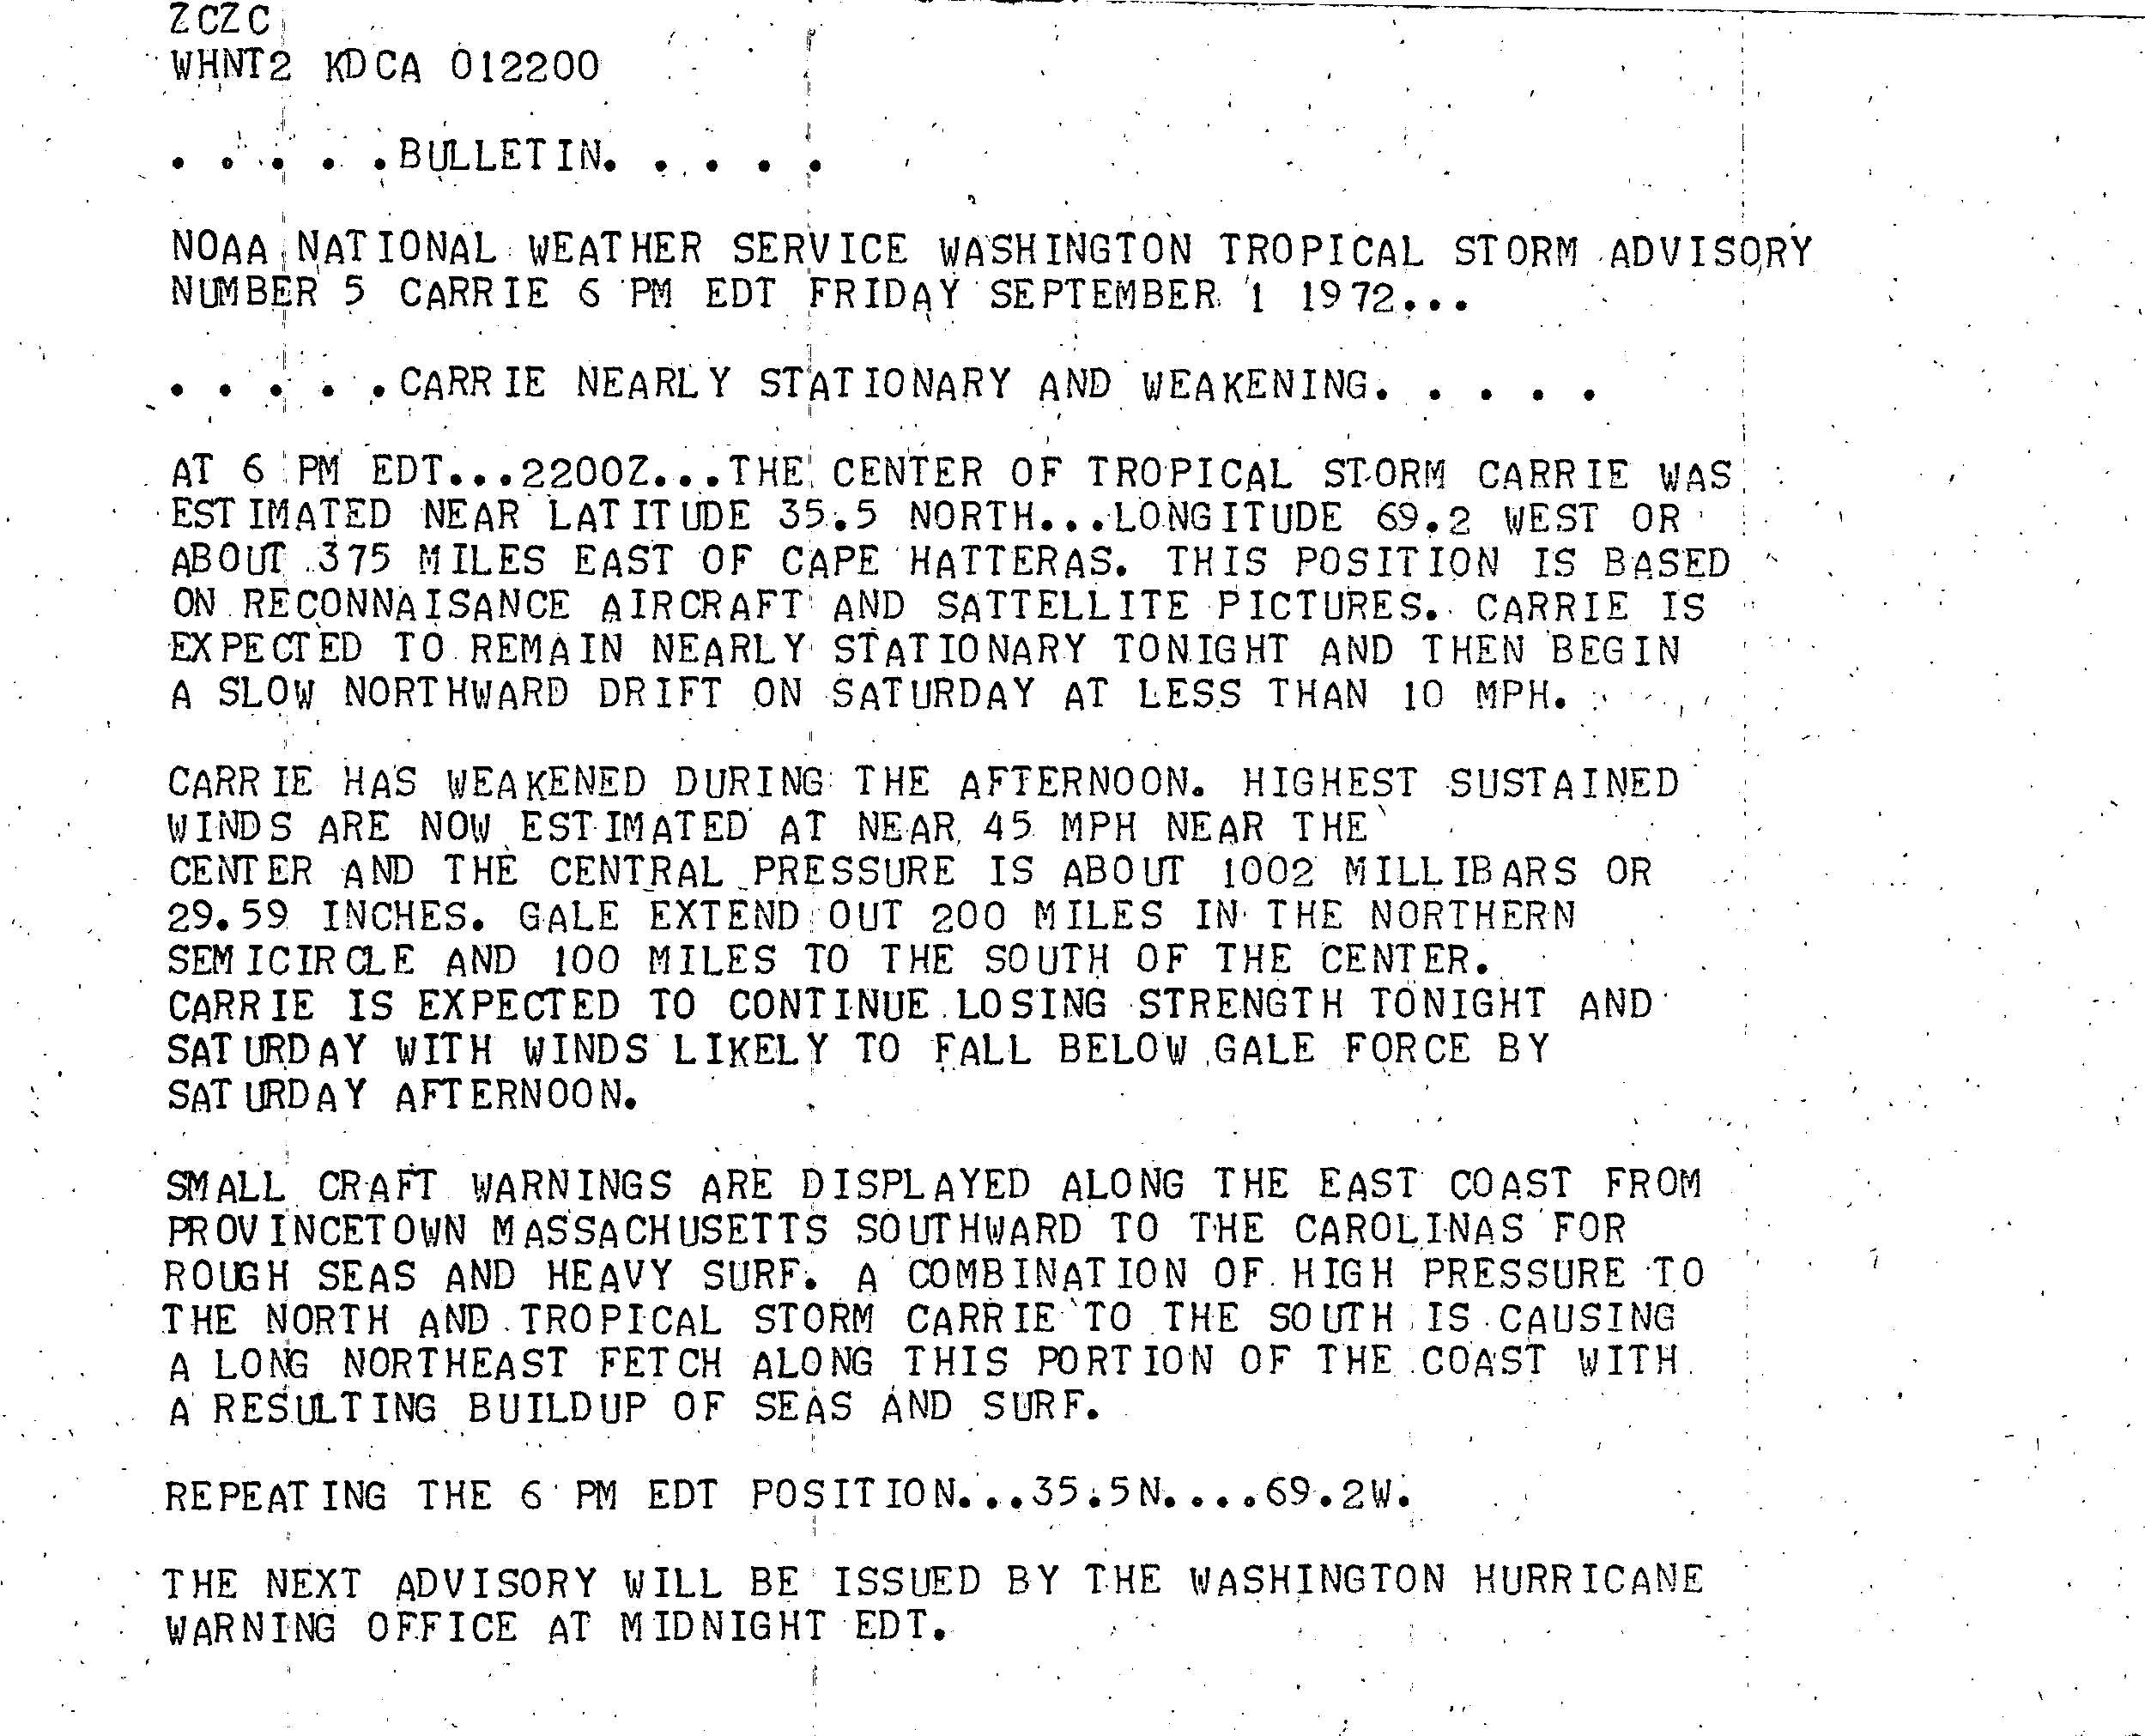
On August 31, reconnaissance aircraft flying into the cyclone reported maximum sustained winds of up to around 55 mph (89 km/h).[1] Post-storm reanalysis estimated the depression had strengthened into a tropical storm at around 0000 UTC on August 31.[2] Operationally, however, it was not recognized as such until 2200 UTC that day, when it was assigned the name Carrie. At the time, the system was located approximately 350 miles (560 km) east of Cape Hatteras, North Carolina. A small storm, Carrie slowed drastically in forward movement as it curved northward.[3] By the time it was identified as a tropical storm in real-time, Carrie had already reached its initial peak intensity with maximum sustained winds of 60 mph (97 km/h) and a minimum central pressure of 1,002 millibars (29.6 inHg), and strong wind shear inhibited immediate strengthening as it continue to slow to a drift.
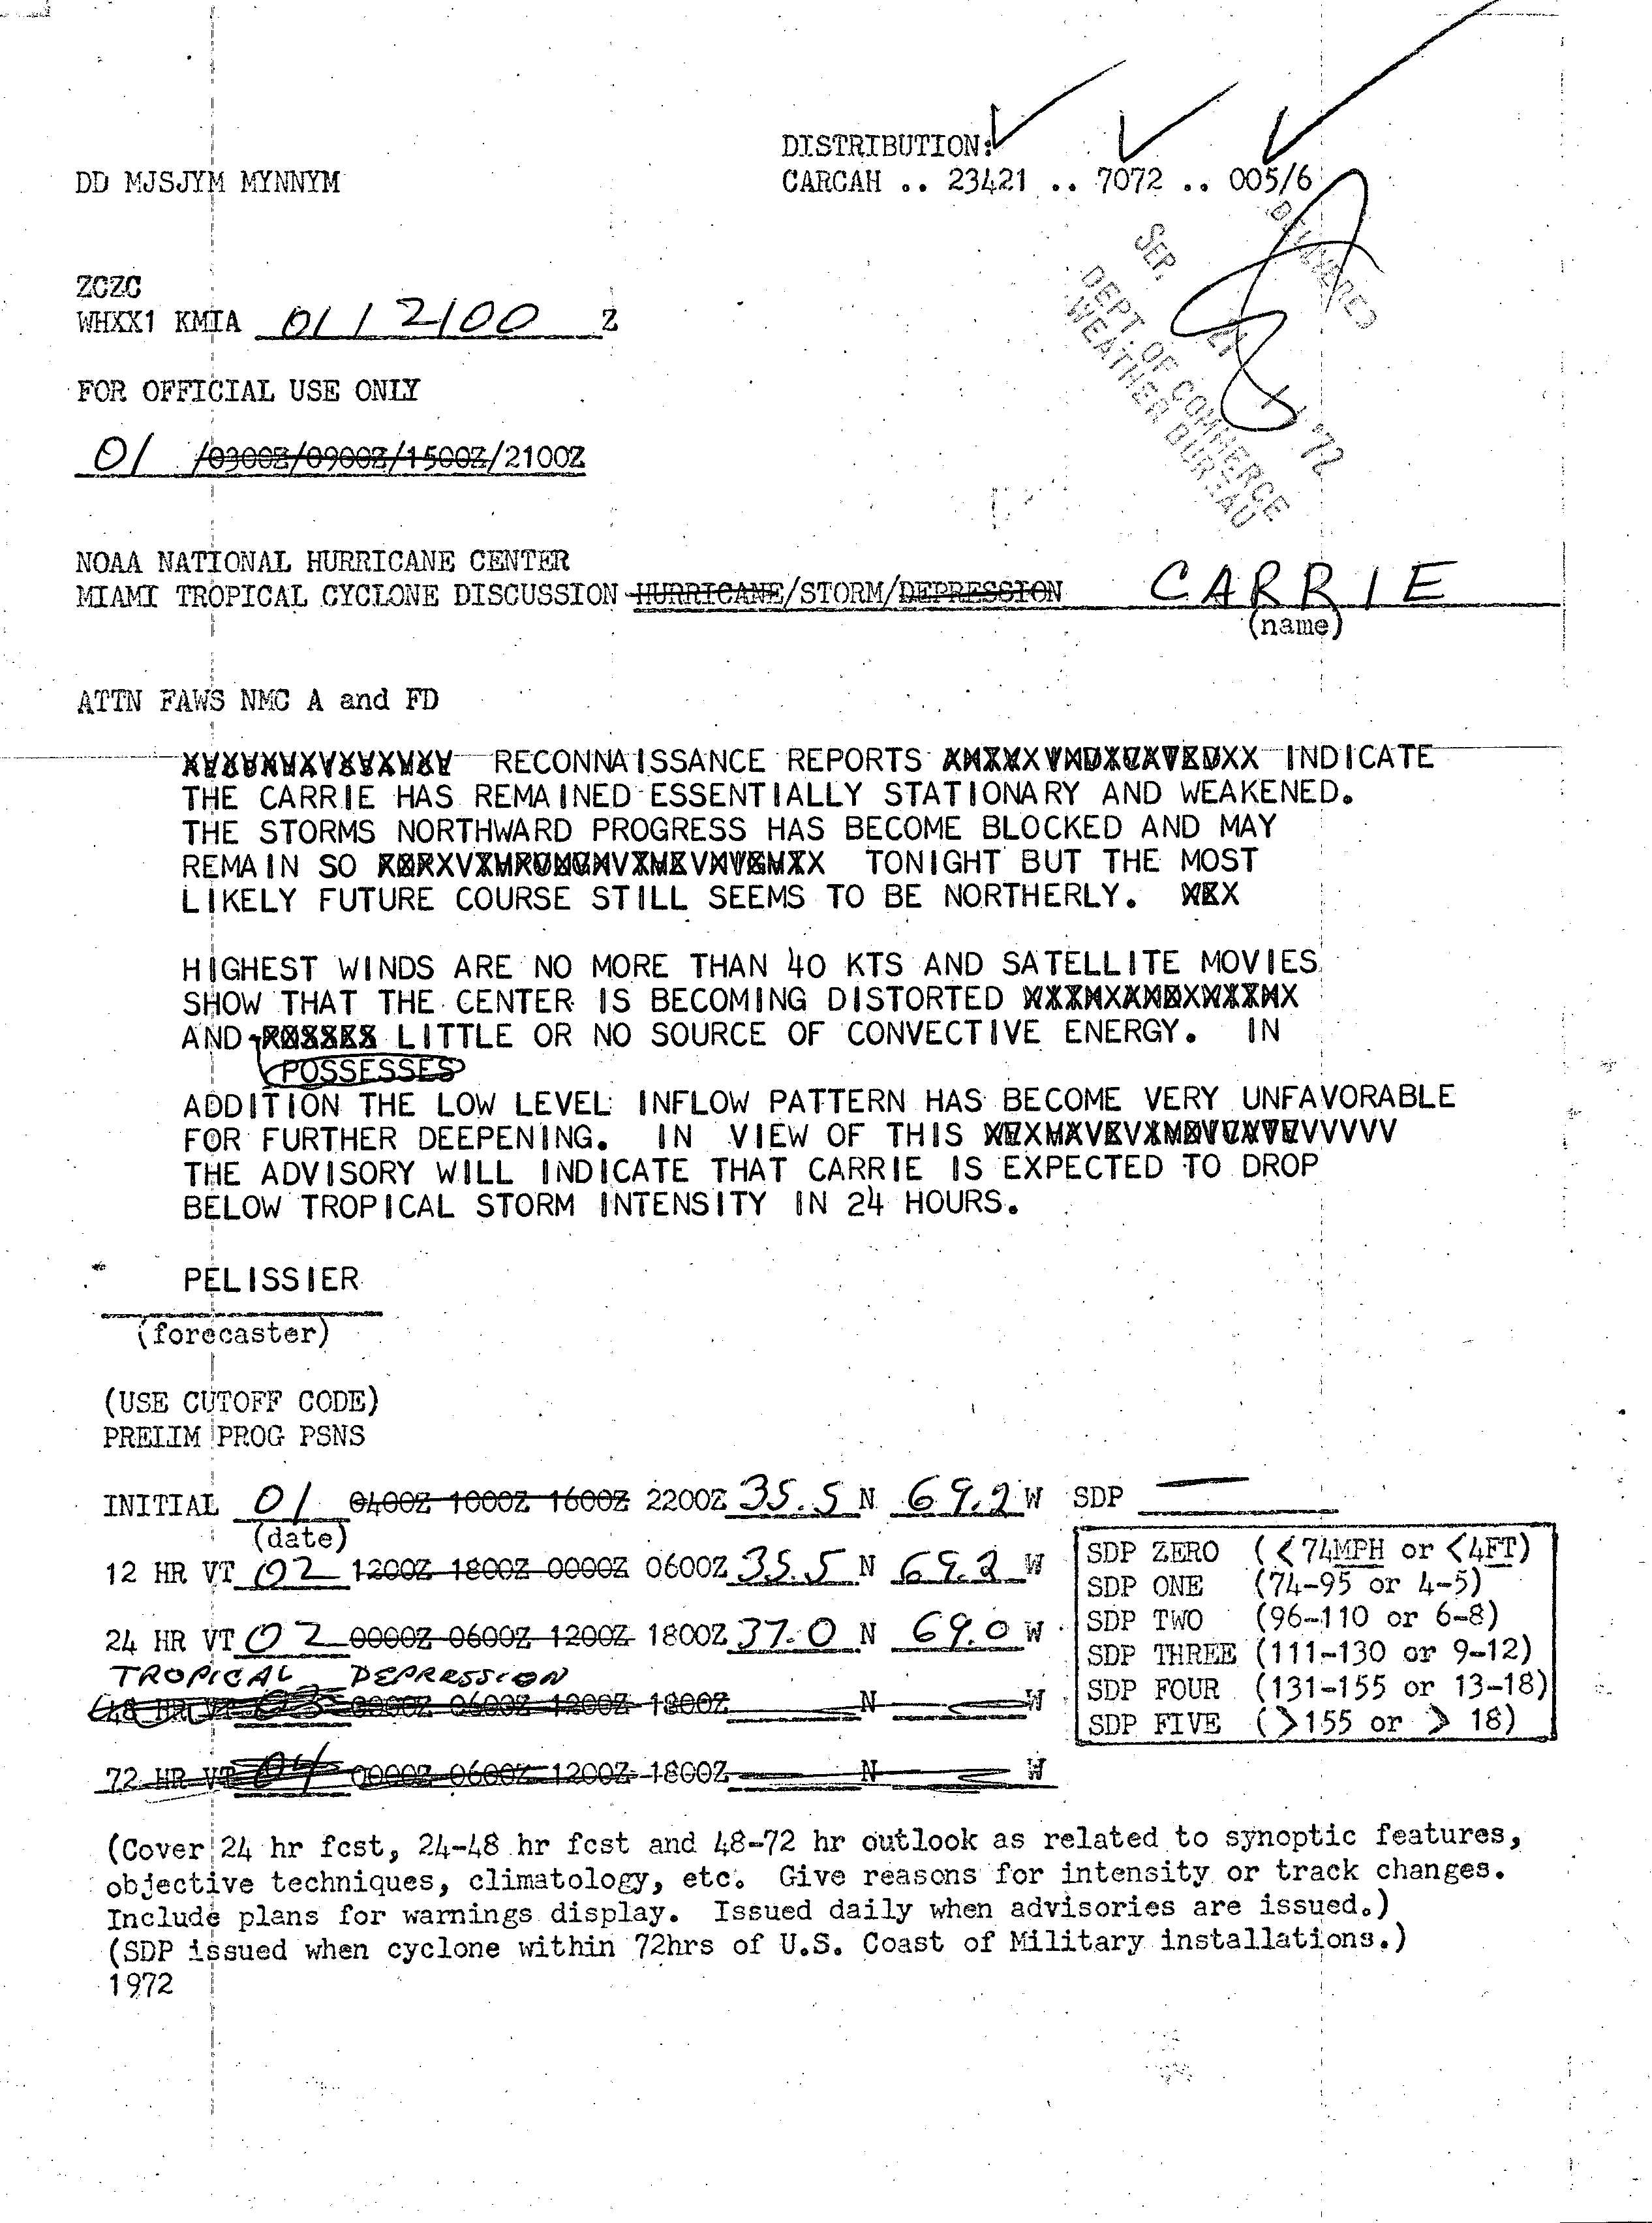
On September 1, Carrie began to weaken, and by early on September 2, it had dwindled to a minimal tropical storm with winds of only 40 mph (64 km/h).[1][2] Satellite imagery indicated that the storm's center of circulation had become distorted with little or no associated convection.[4] At its weakest, the storm's highest winds were found far from the center, likely generated more by the increasing pressure gradient in relation to an anticyclone to the north than by the low pressure center itself.[1]
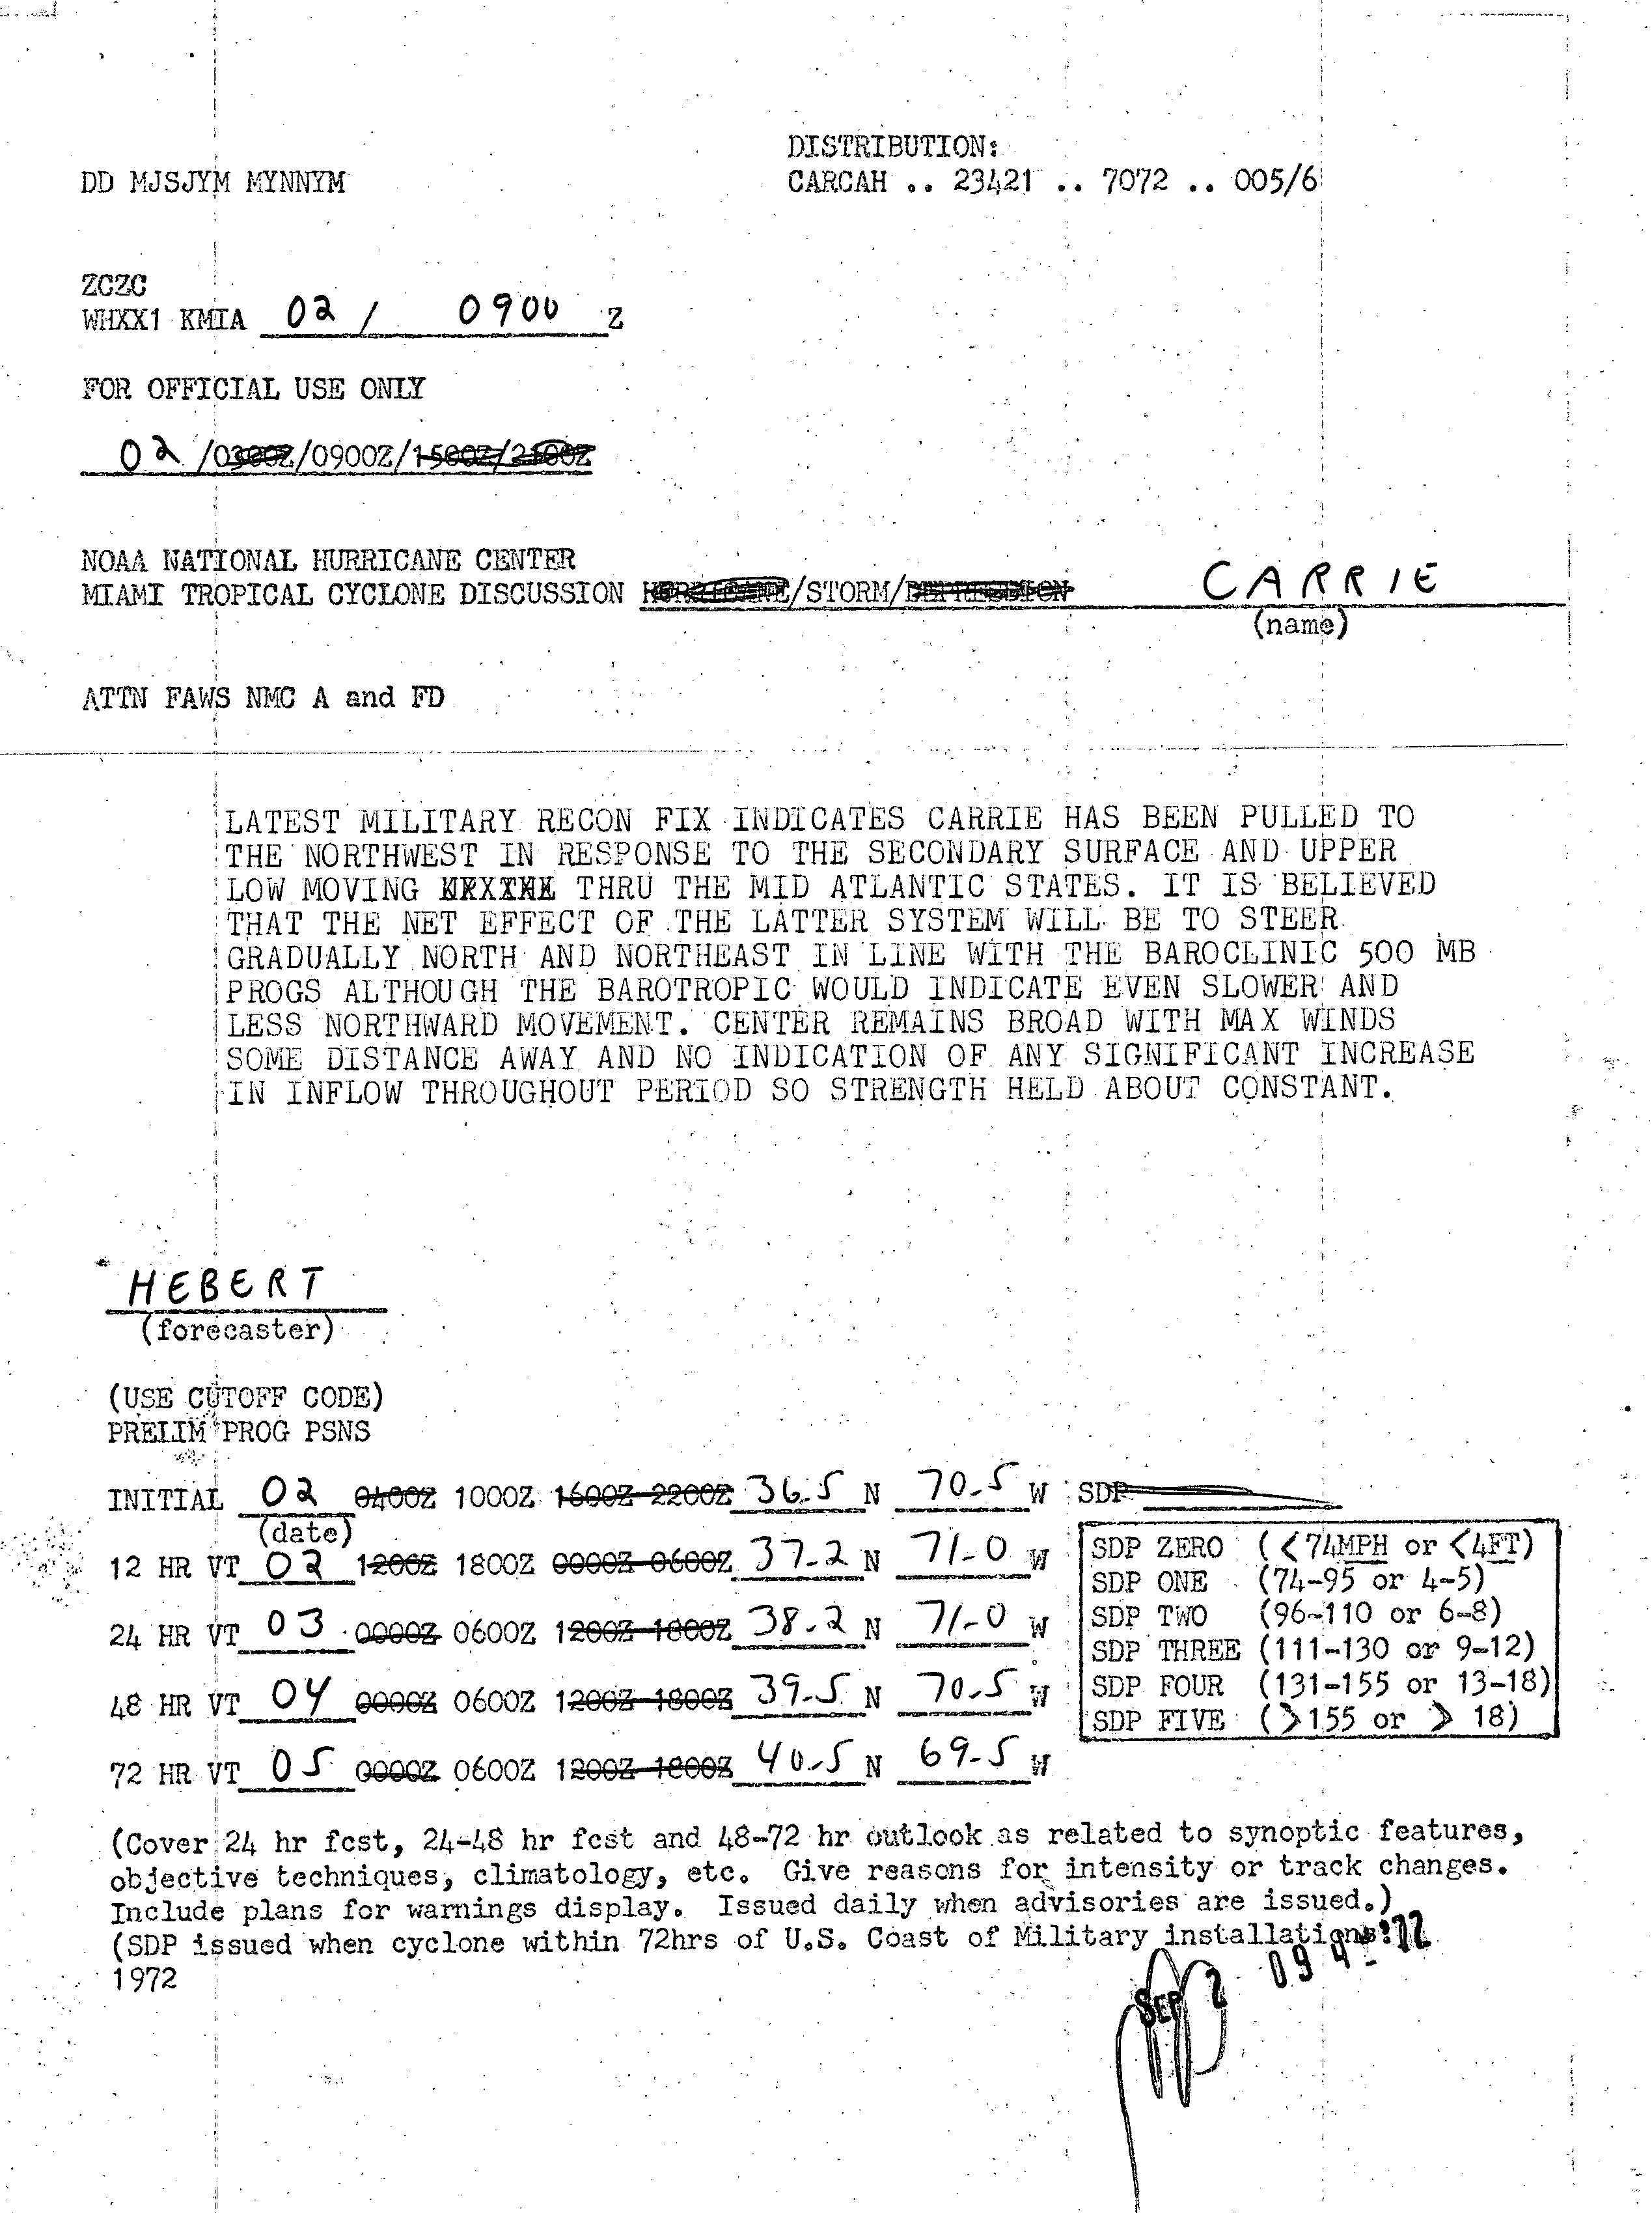
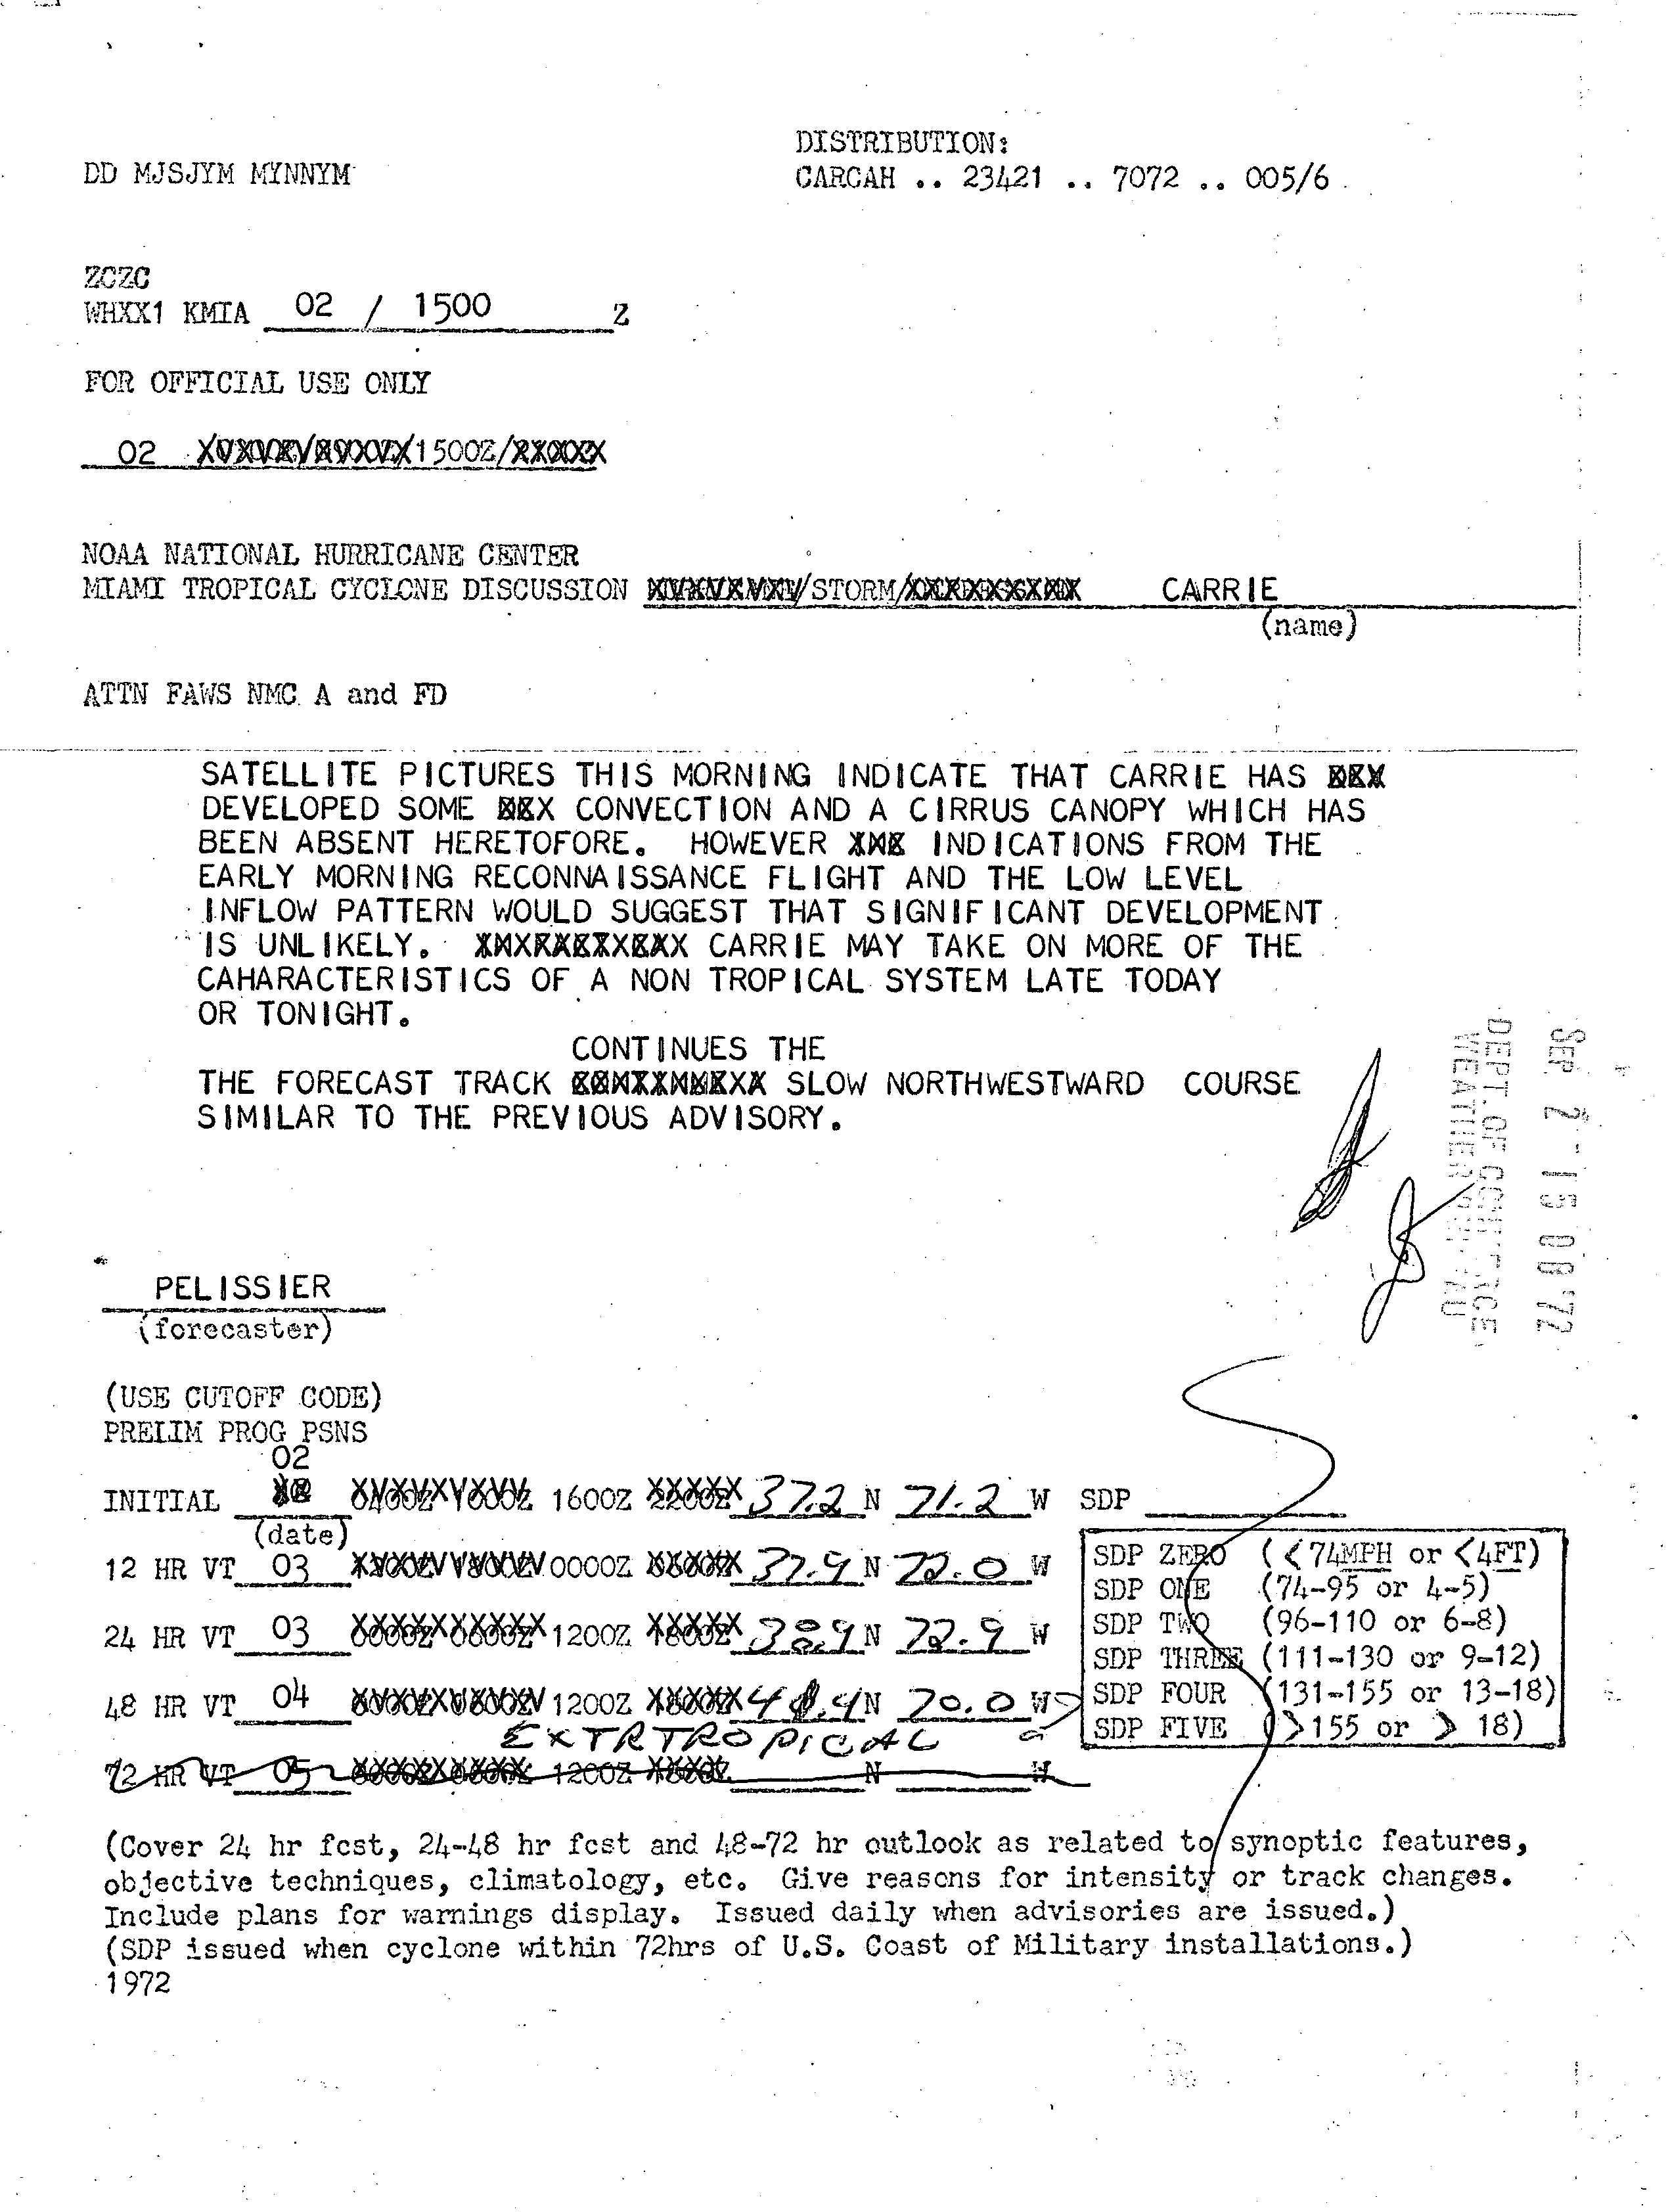
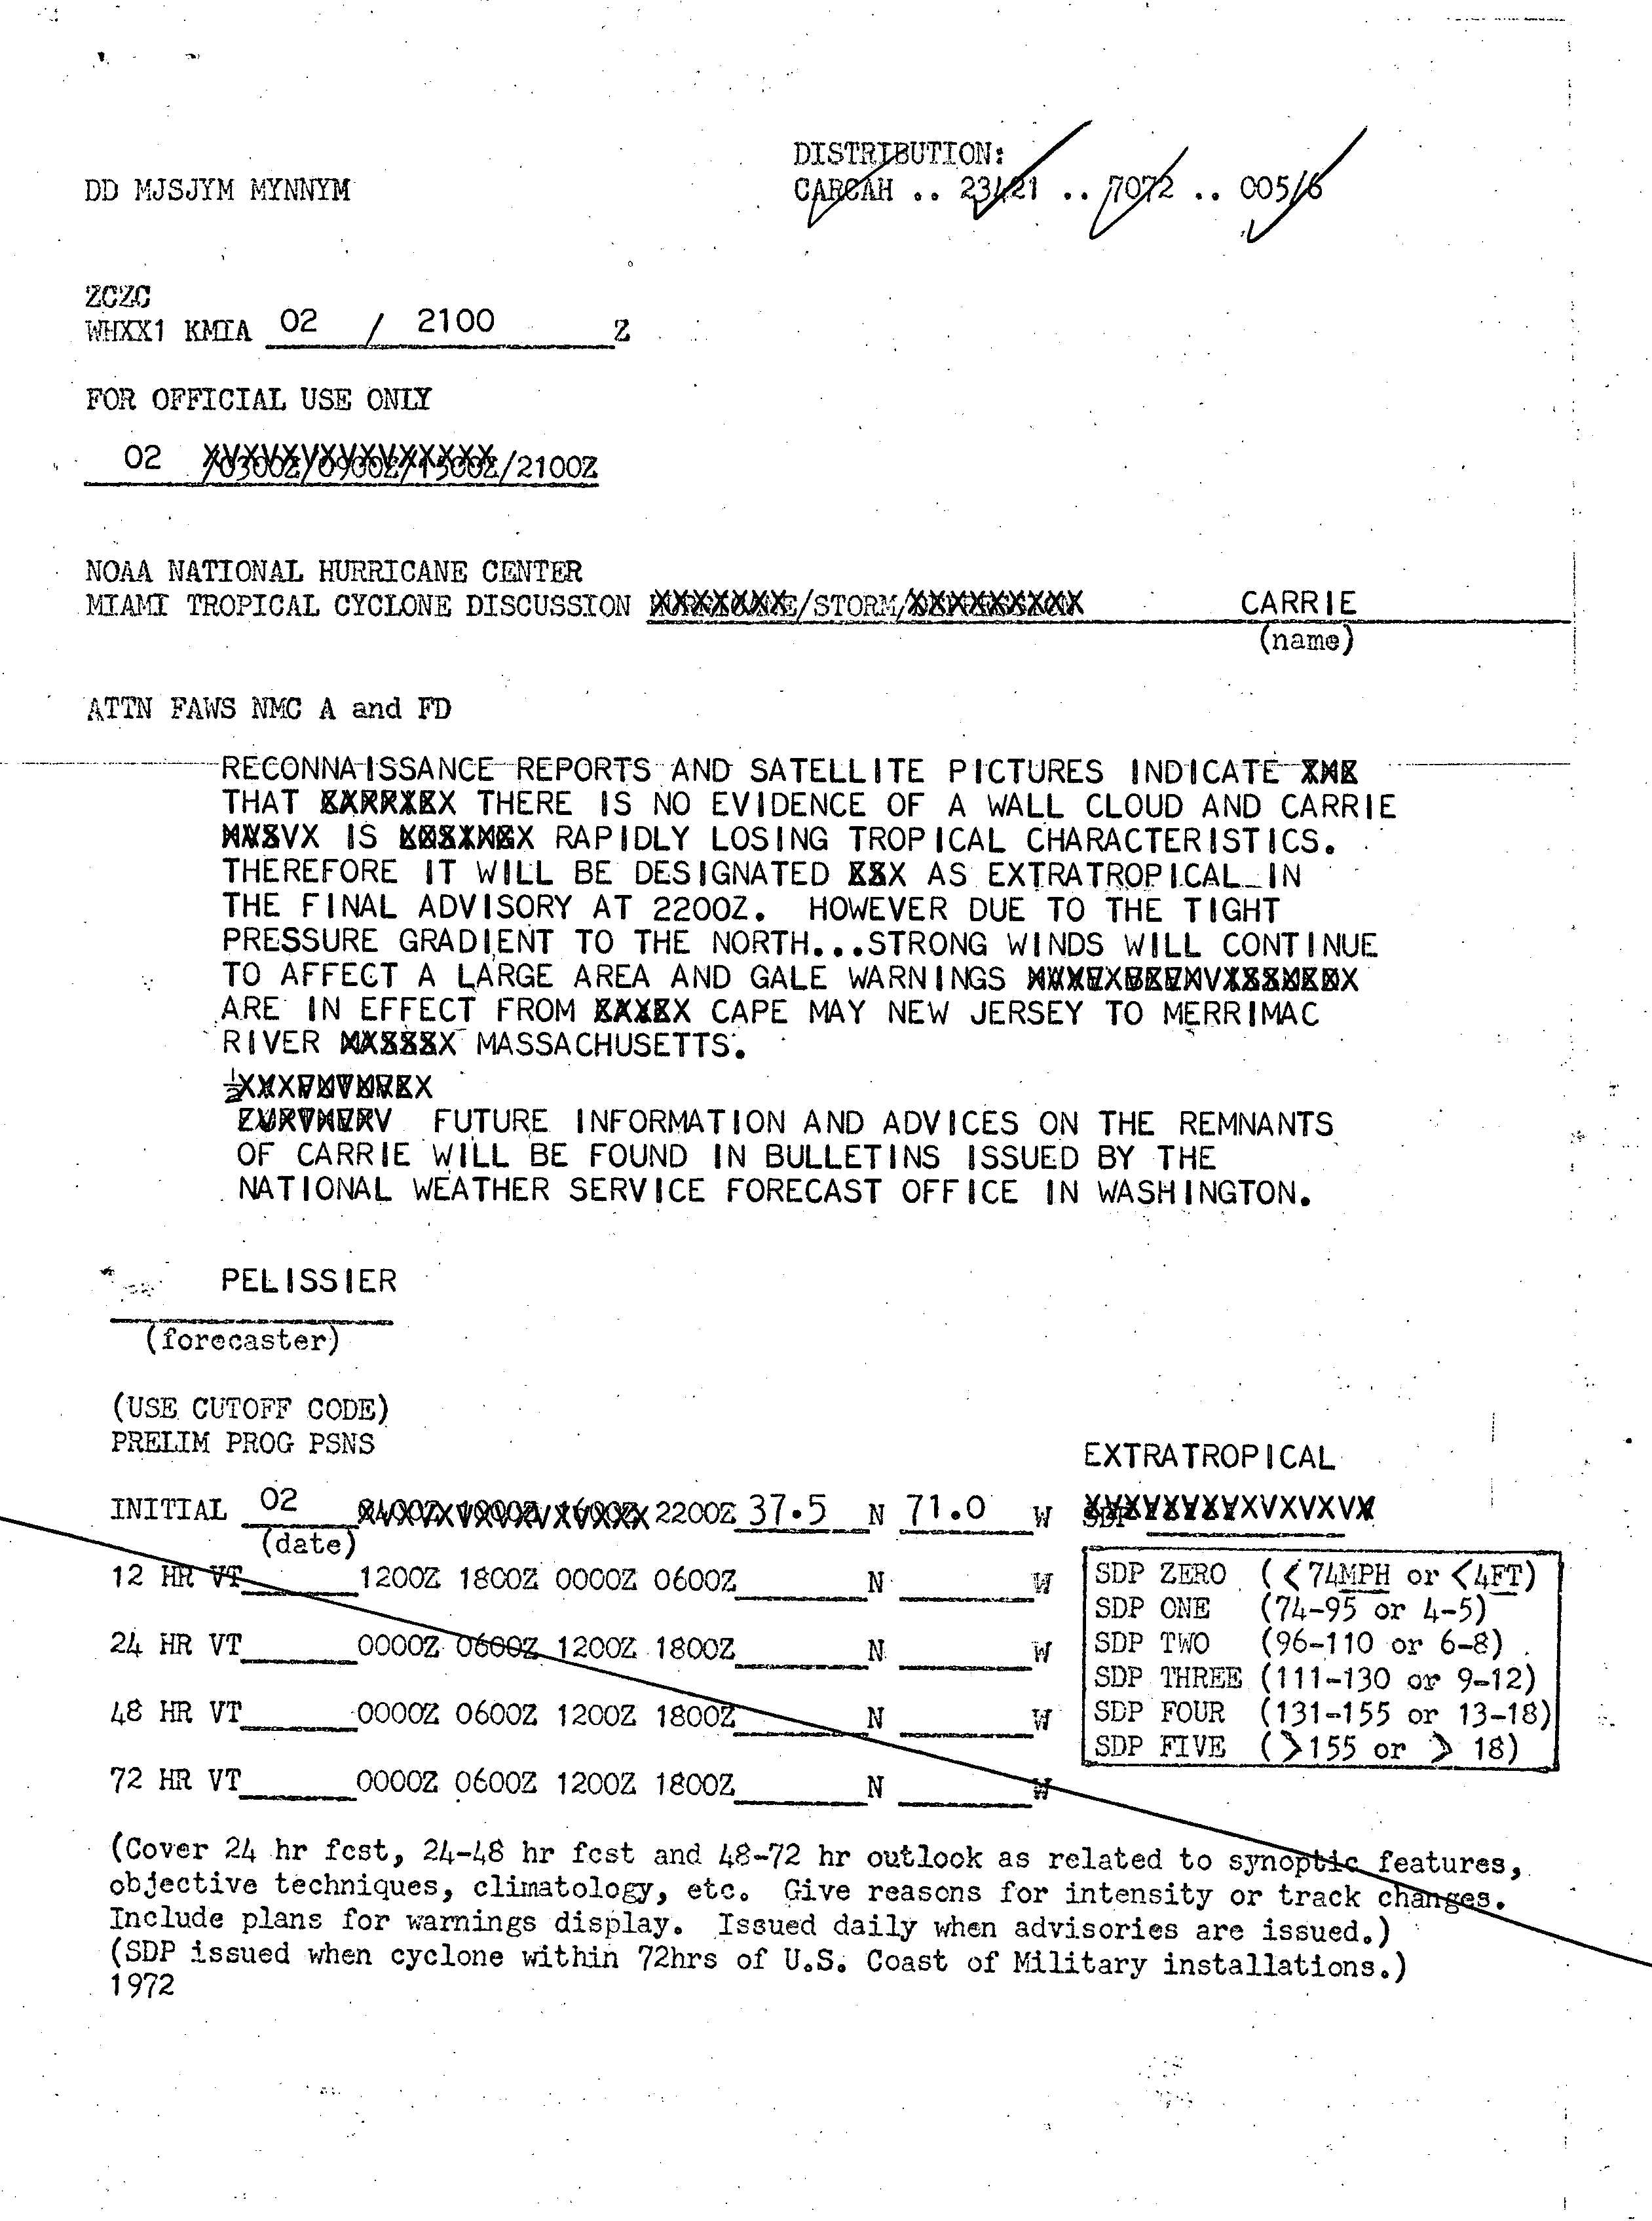
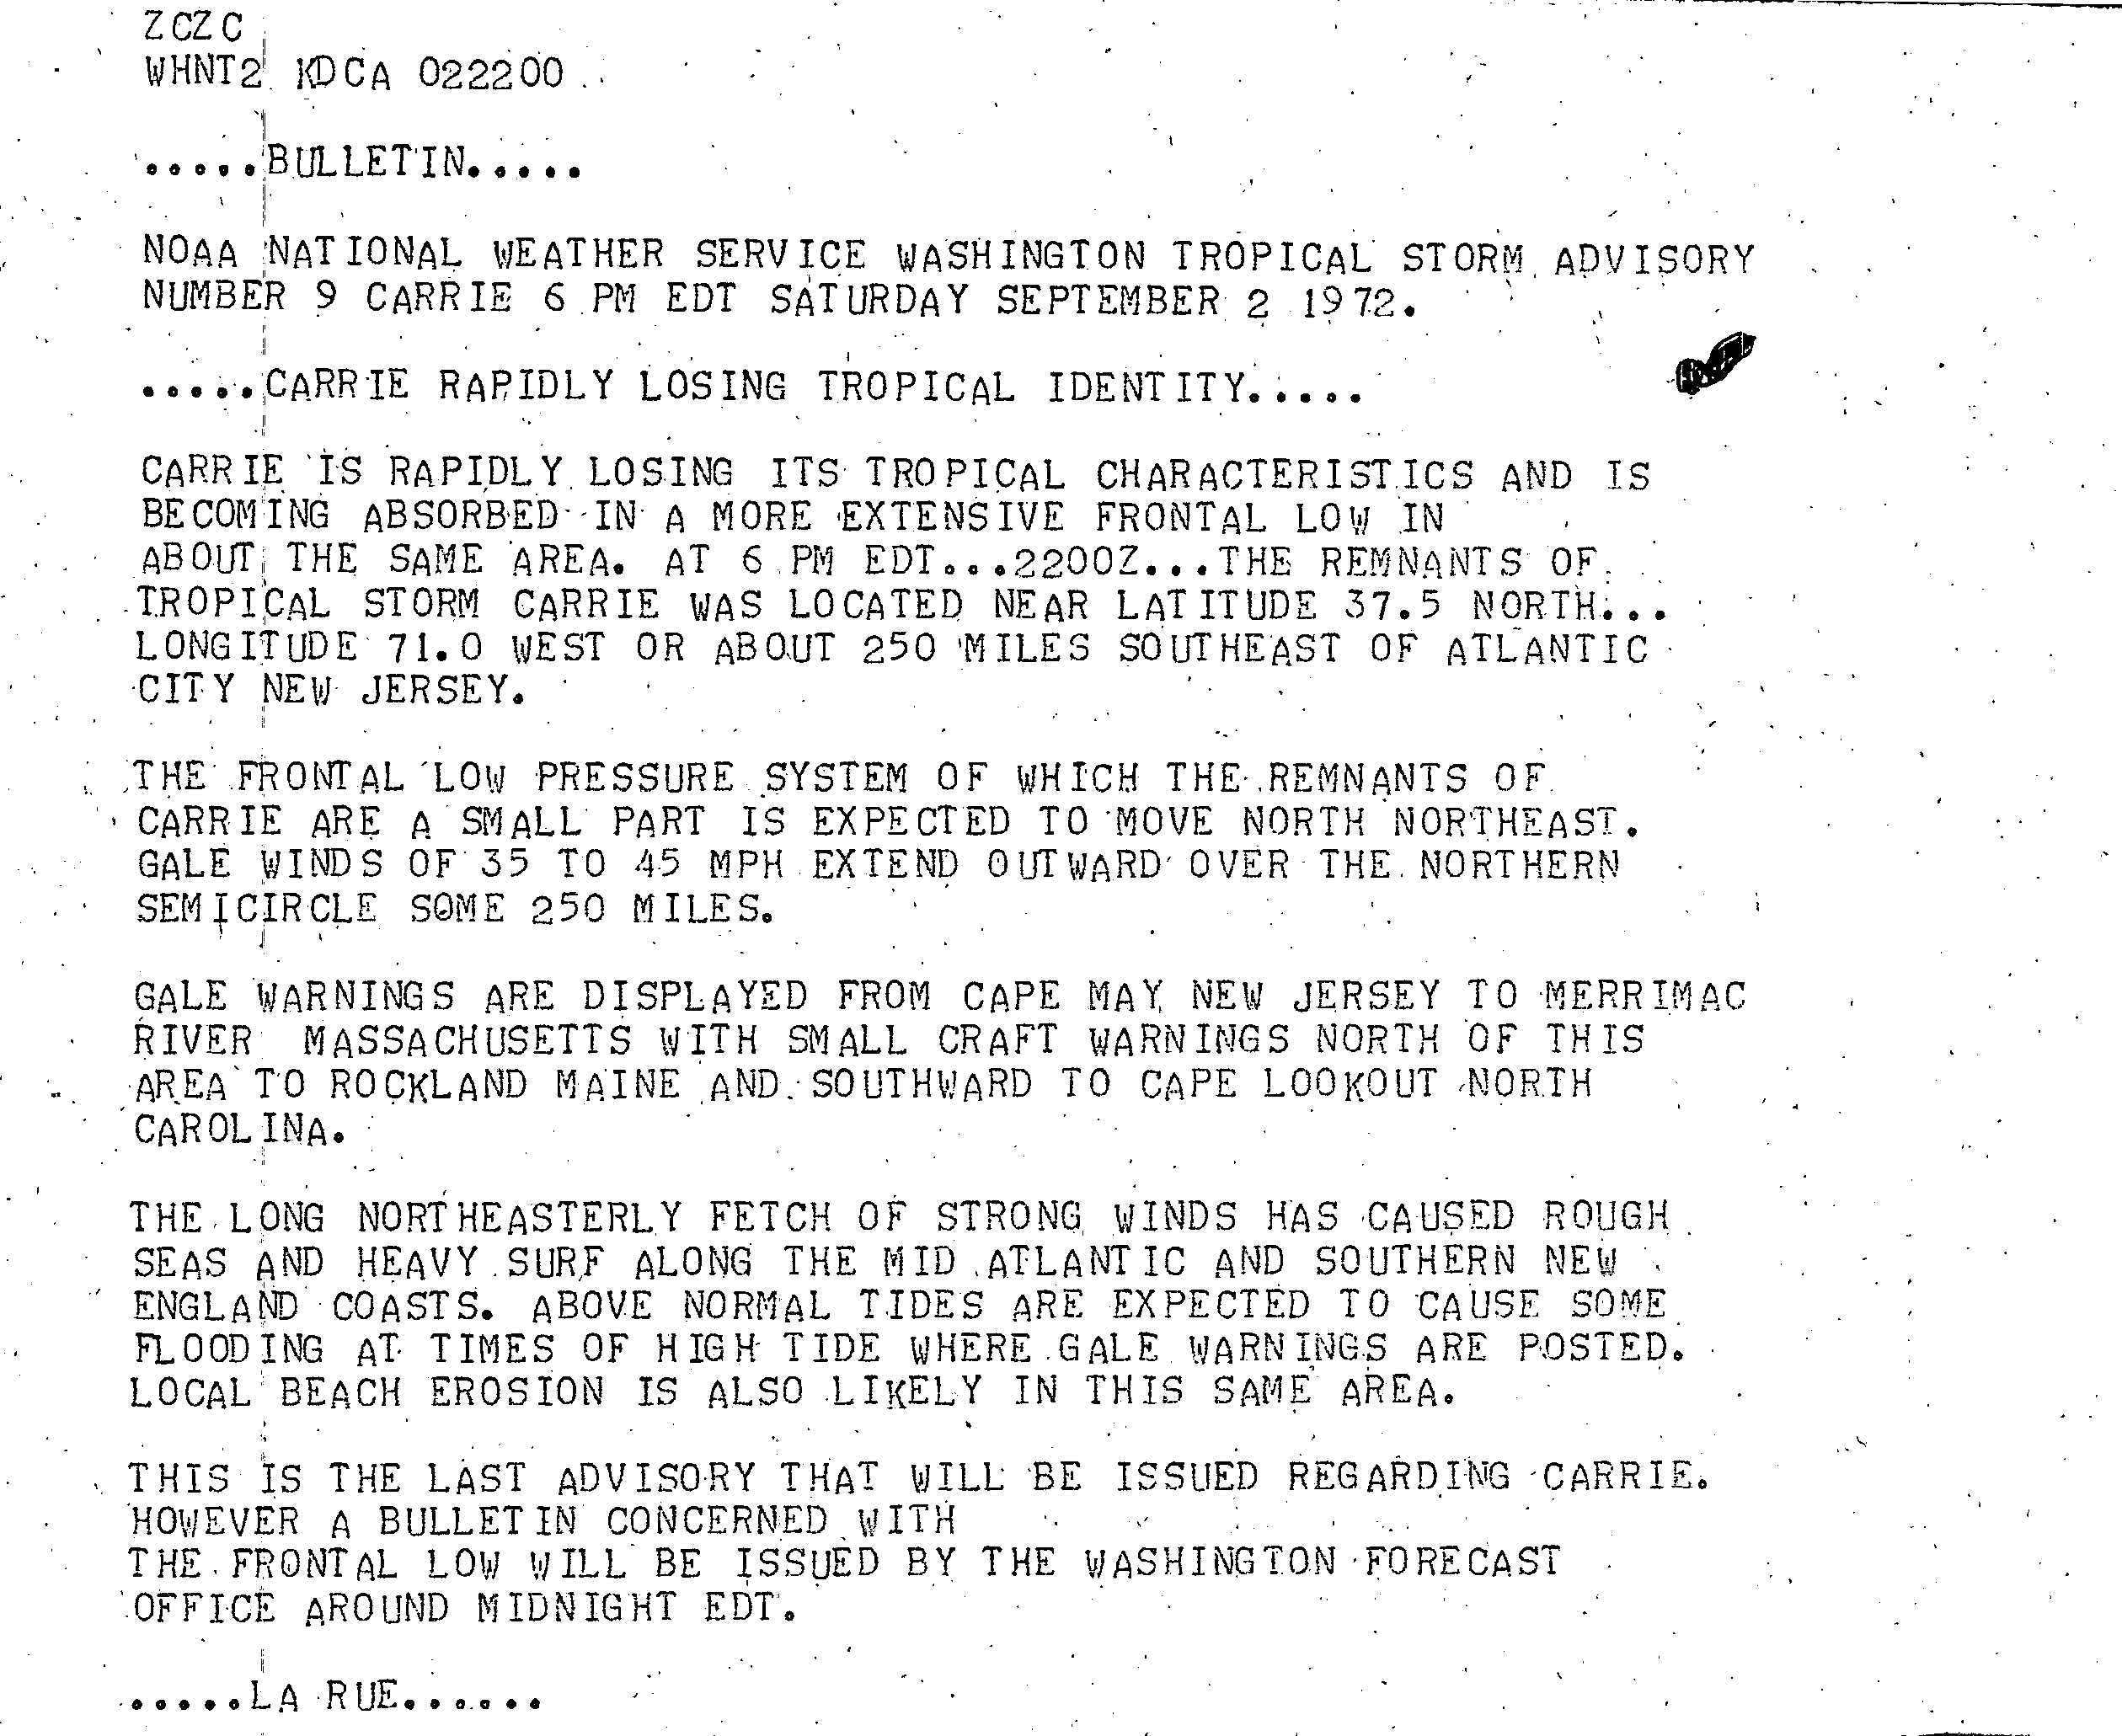
A low pressure system moving through the Mid-Atlantic states pulled Carrie northwest, back toward the United States East Coast, at an accelerated forward speed.[5] Later on September 2, the storm had begun to show signs of reorganization, including an improved appearance on satellite imagery and the development of some thunderstorm activity, although significant reintensification was considered unlikely.[6] However, with the advance of a trough embedded in the westerlies, Carrie quickly deepened under the influence of baroclinic processes. While the storm's maximum sustained winds increased, it also began to shed its tropical characteristics and resemble an extratropical cyclone.[1] Moving once again toward the north-northeast, Carrie was declared extratropical by the National Hurricane Center during the late afternoon on September 2.[7]
In the official Atlantic Hurricane Database, however, Carrie is listed as a tropical cyclone until 1800 UTC on September 3, at which point it possessed winds of 70 mph (110 km/h) and a central barometric pressure of 993 mb (29.3 inHg). As a result, these data are considered representative of the storm's peak intensity.[2] Regardless of its status, the storm was a large and intense system as it progressed north and neared New England, generating strong winds and rough surf along the coast.[8] Having fully transitioned into an extratropical system, the storm made landfall near Eastport, Maine on September 4 and slowly weakened as it continued north up the Gulf of Saint Lawrence.[1] The cyclone fully dissipated on September 6 in the Gulf.[1]
Preparations and impact[edit]

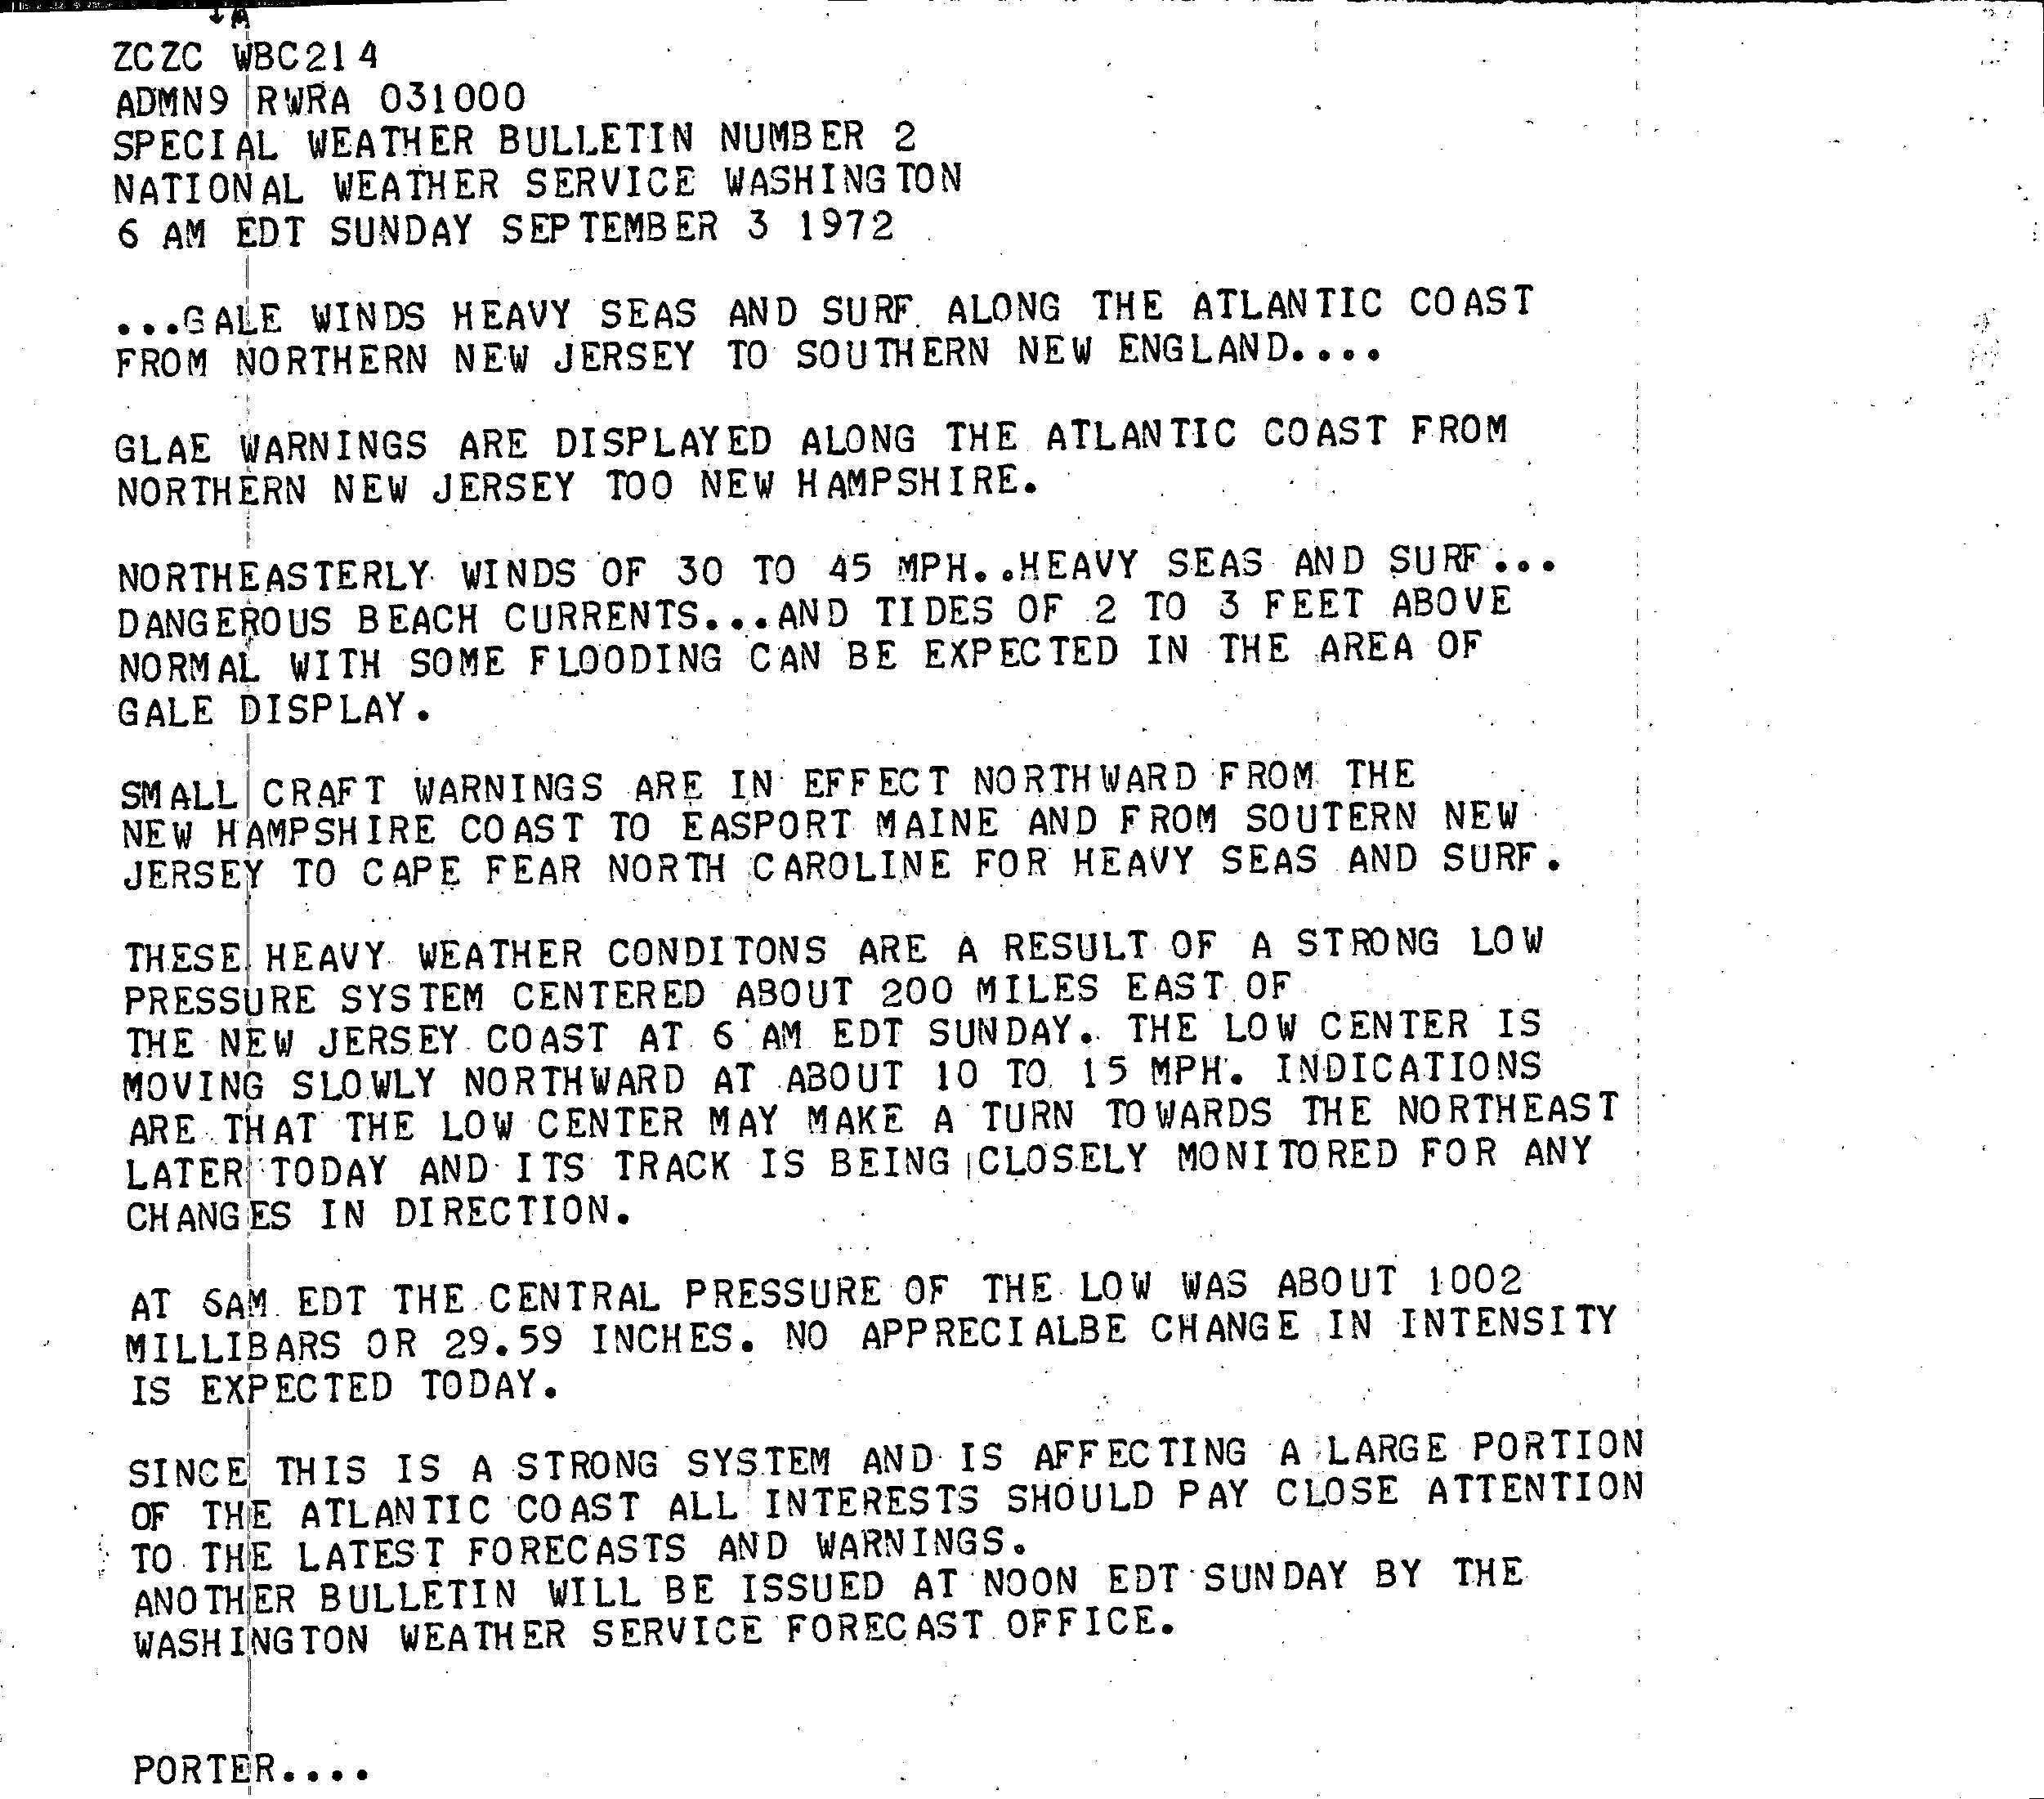
The pressure gradient between Carrie and the high pressure area to its north produced gusty northeasterly winds, and by extension high seas. In response, the National Weather Service issued small craft warnings starting on September 1 and extending from Massachusetts to the Carolinas.[9] Gale warnings were posted the next day from southern New Jersey to the coast of central New England, and the small craft warnings were brought north to Maine.[10]
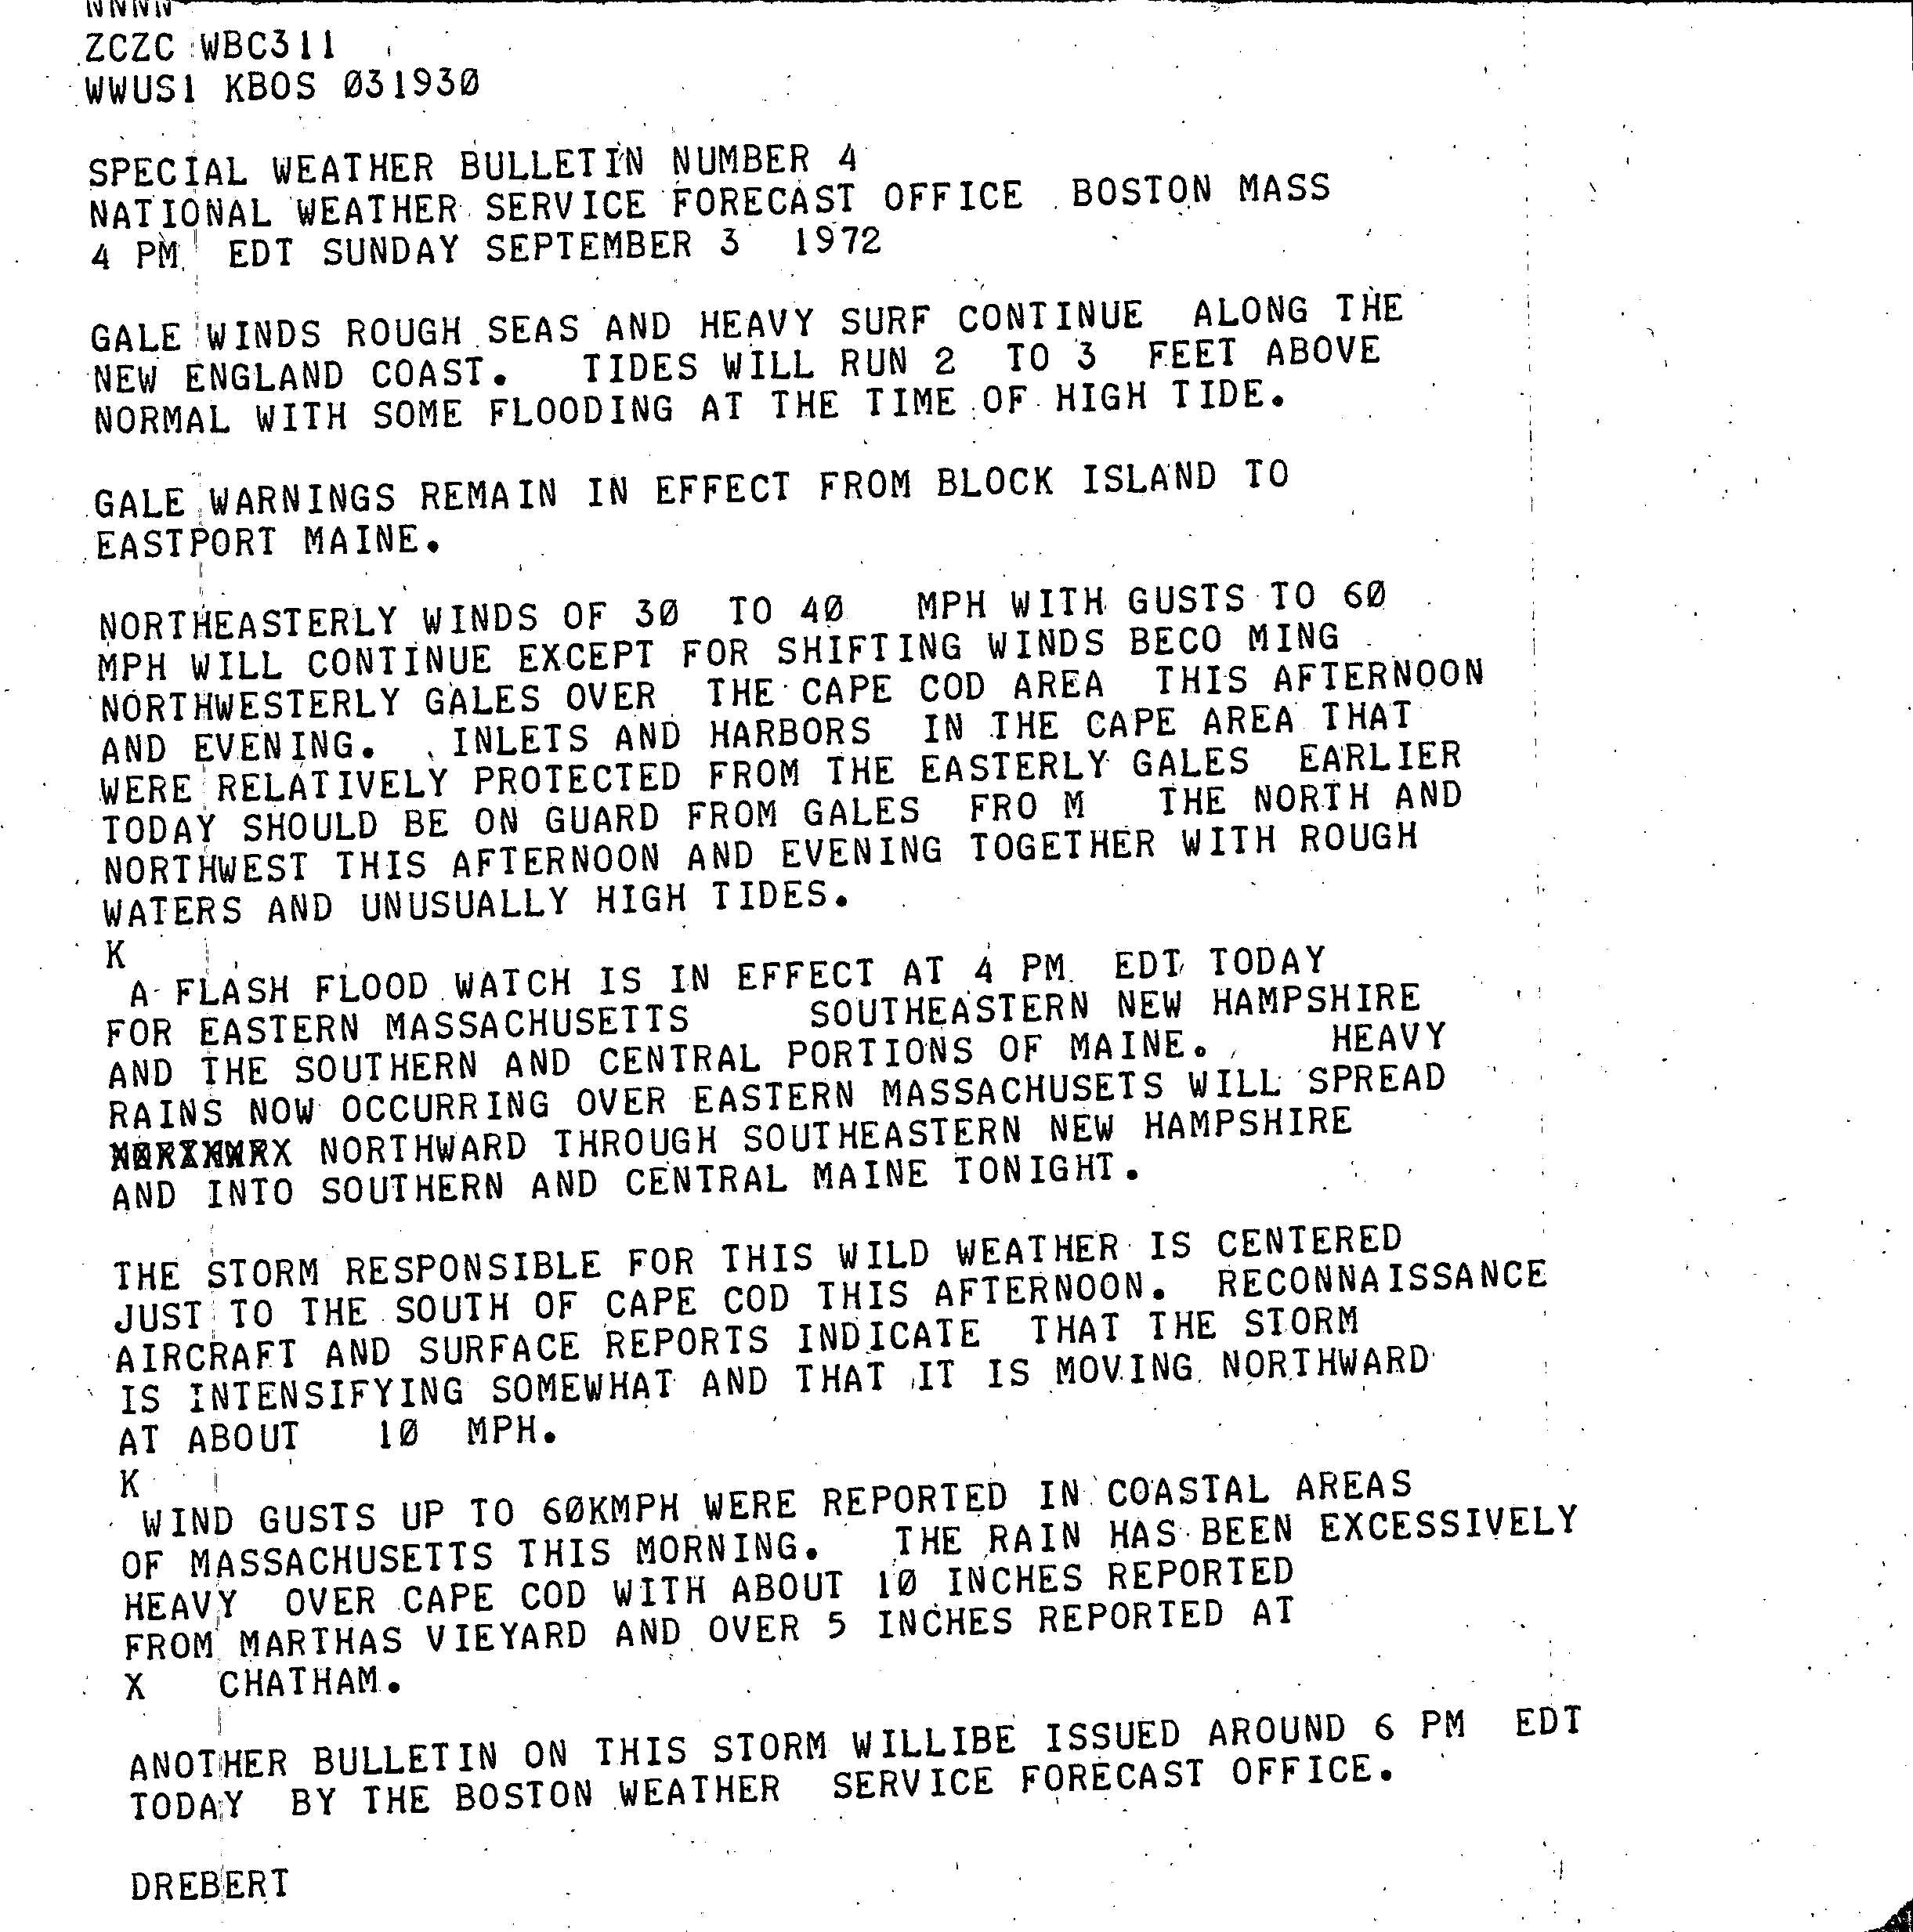
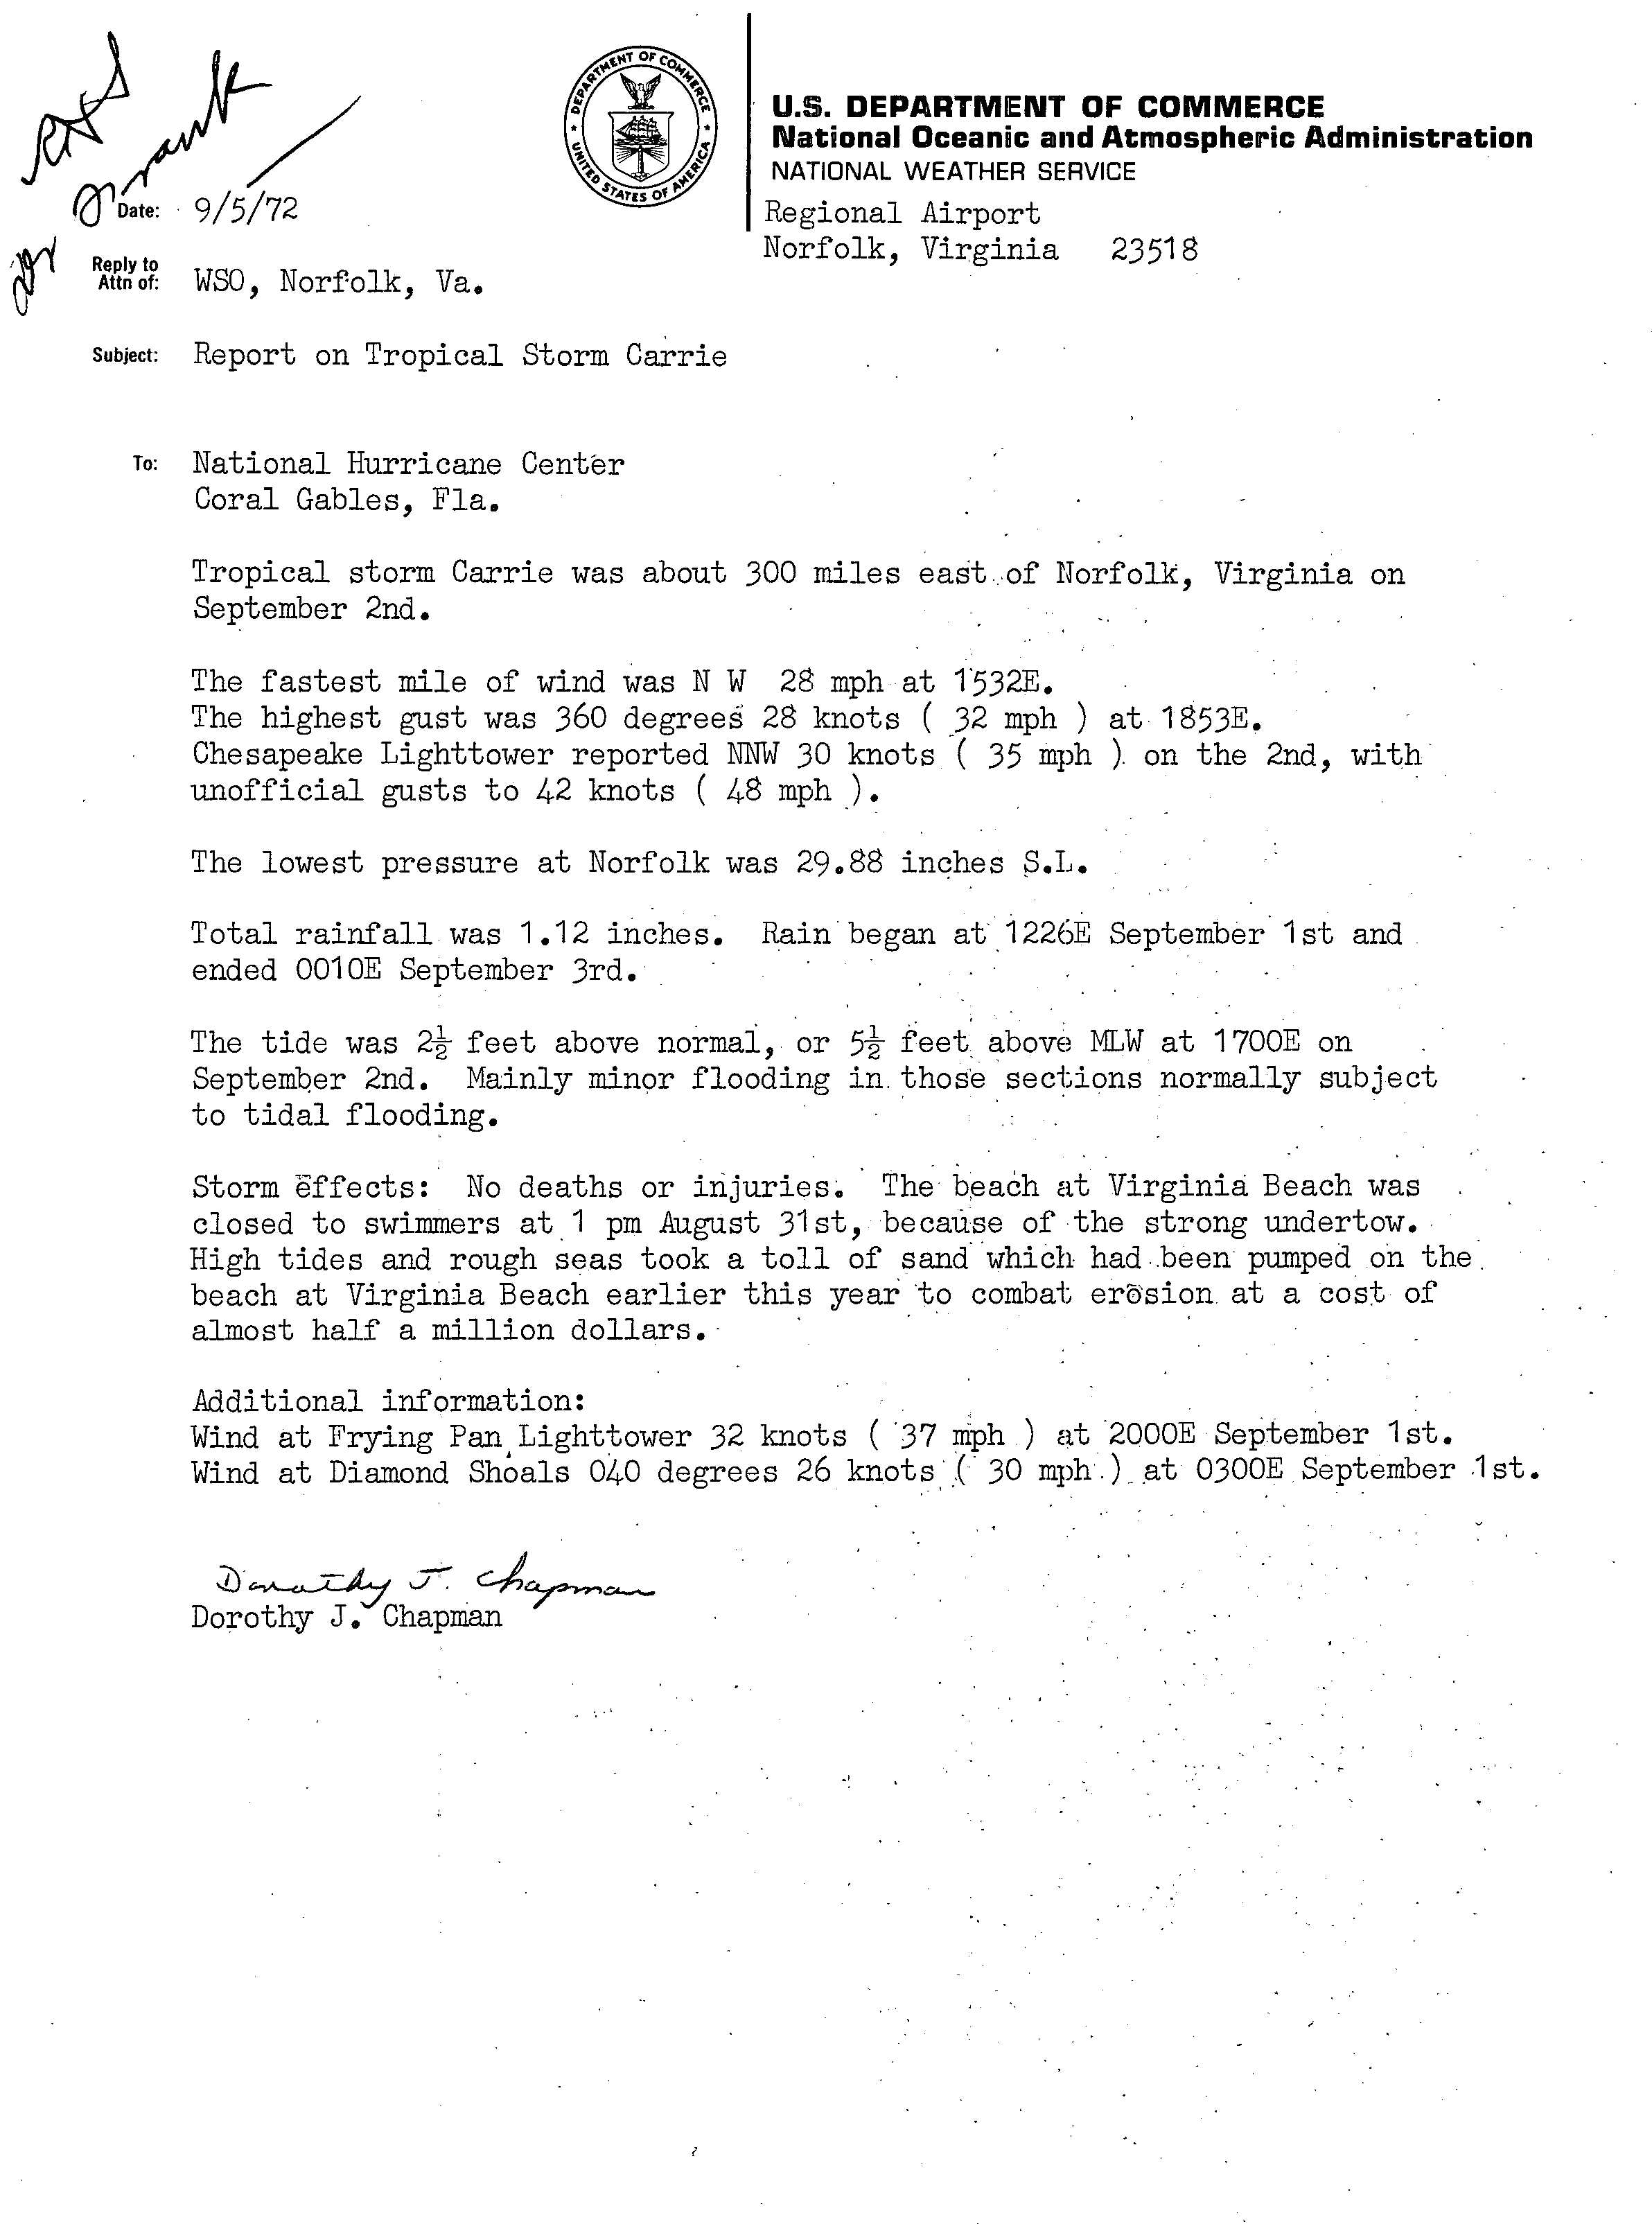
On September 3, the threat of continued heavy rainfall necessitated the issuance of flash flood watches throughout eastern Massachusetts, southeastern New Hampshire, and southern and central Maine.[11] Due to rough surf, the beach at Virginia Beach, Virginia, was closed to swimmers on August 31.[12]
Mid-Atlantic[edit]
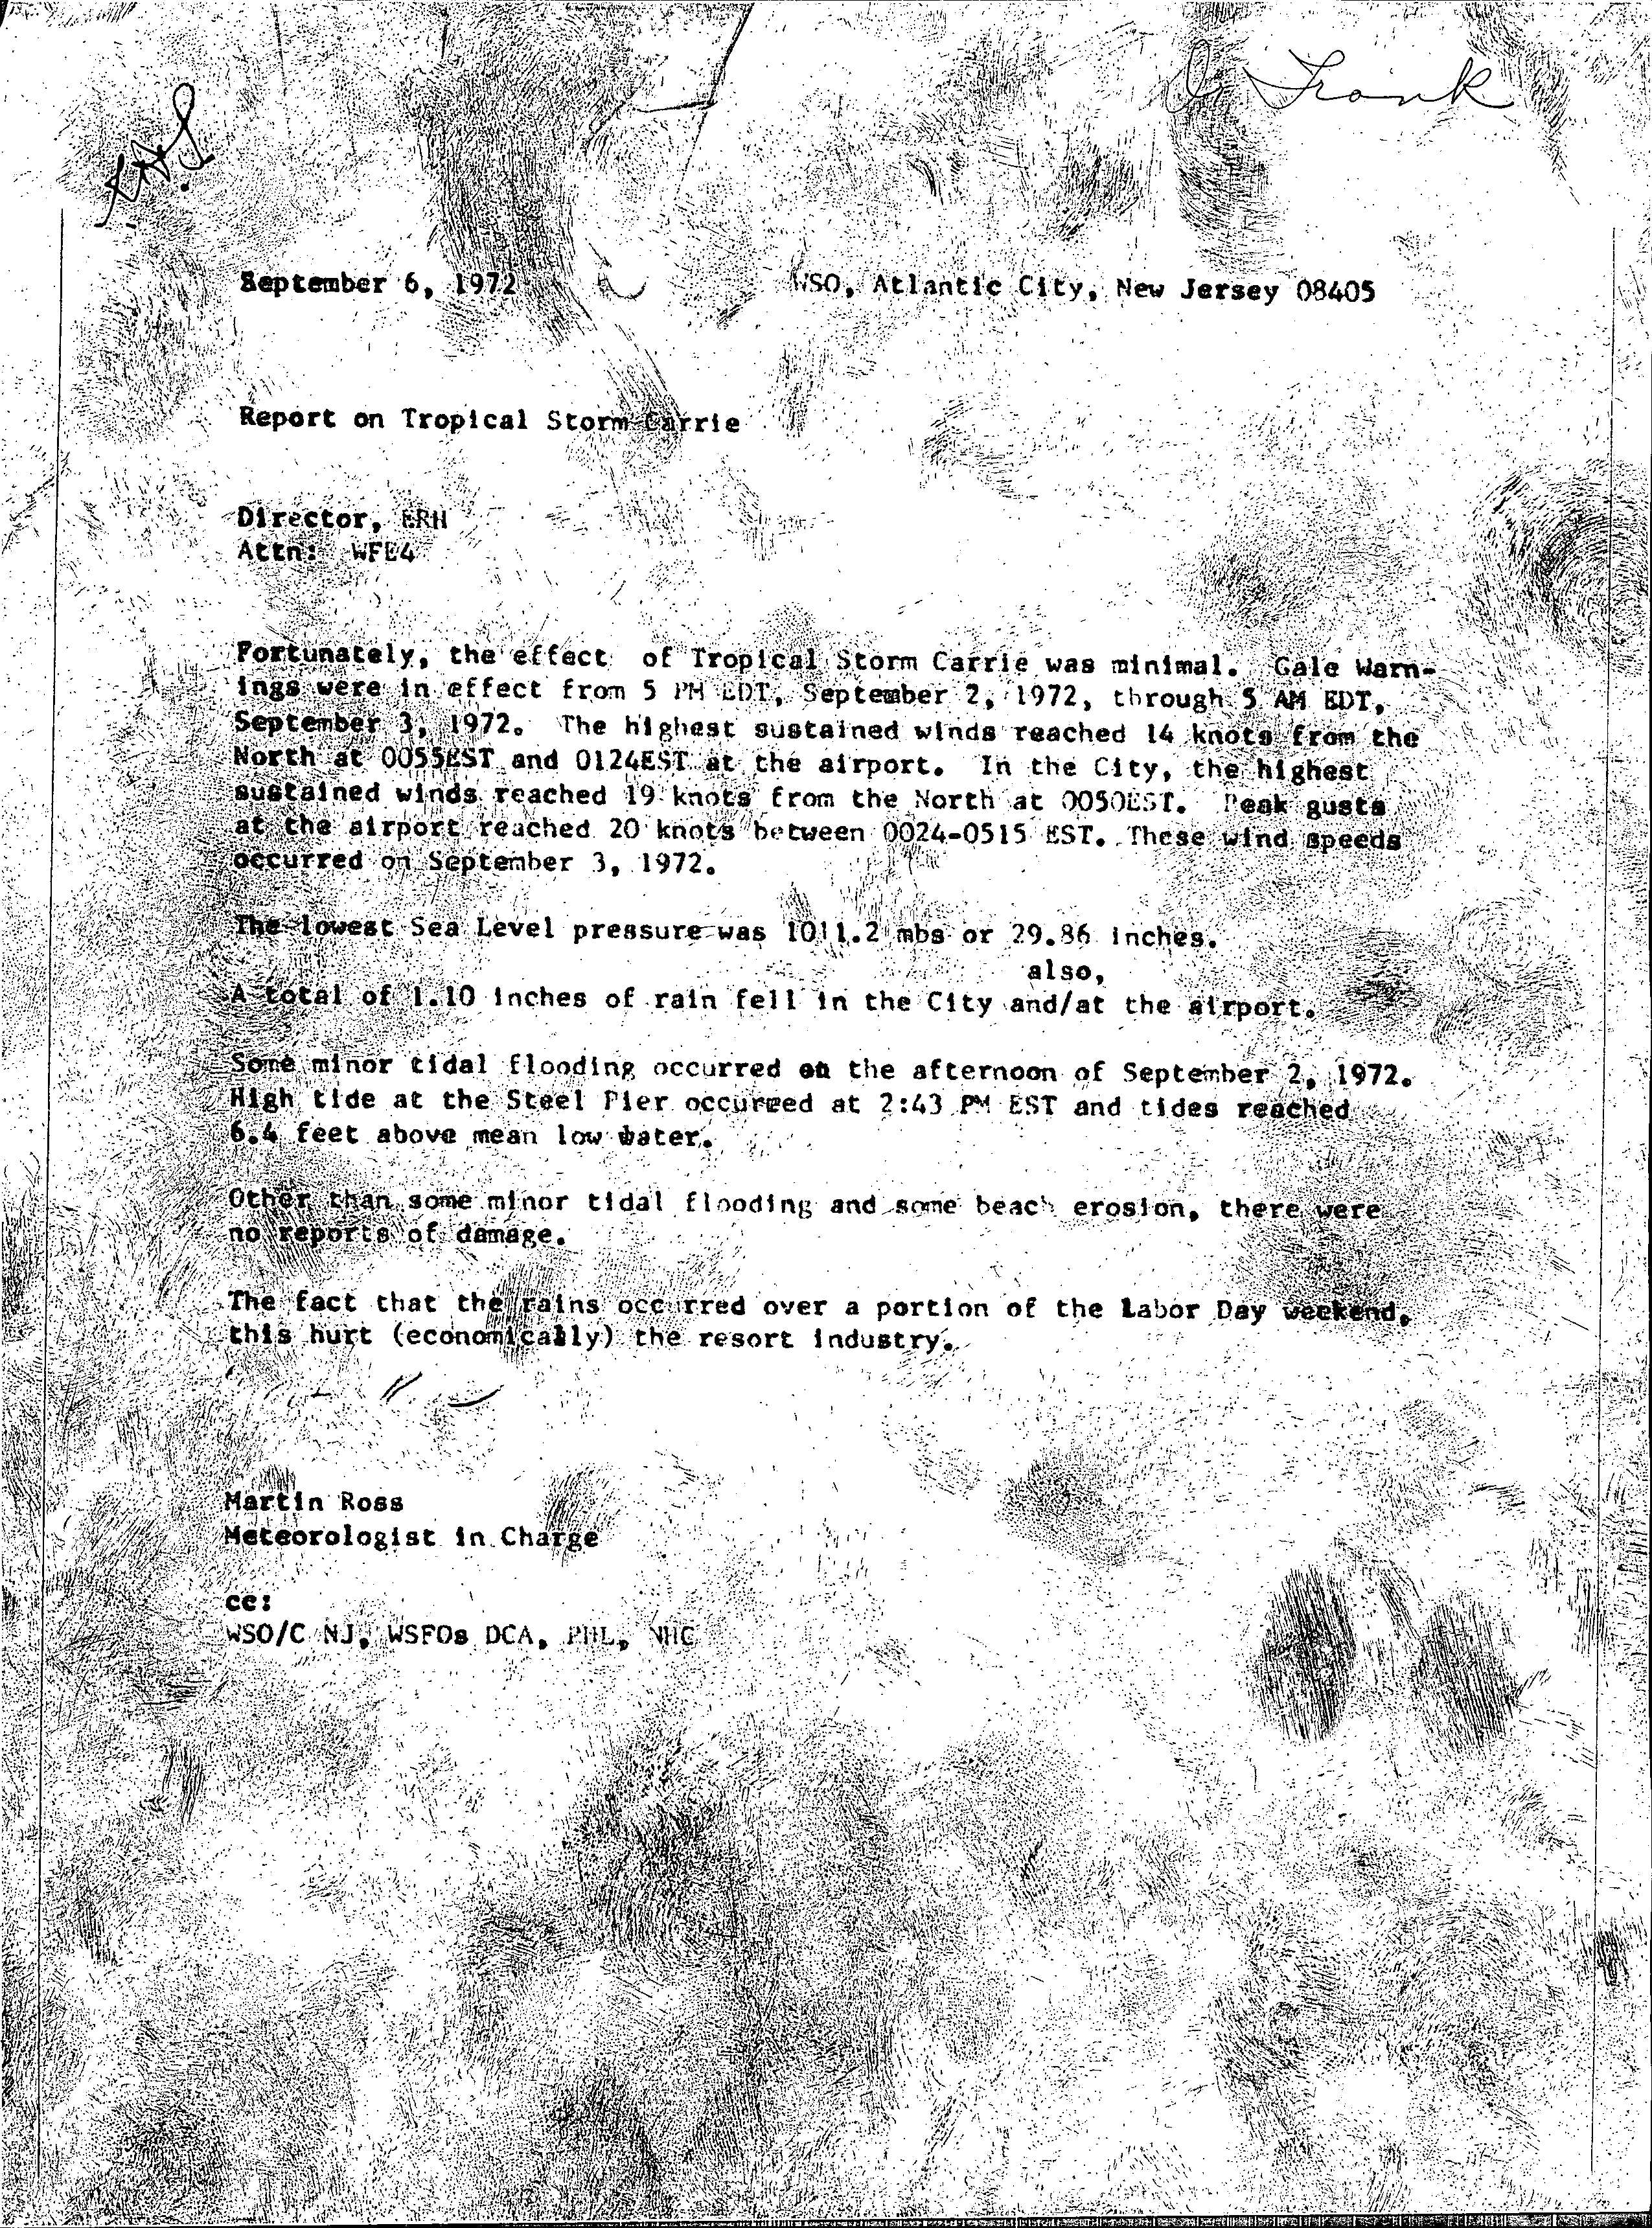
Carrie had minimal effects on the U.S. East Coast south of the Mid-Atlantic states, limited to moderate winds and generally light rainfall. Precipitation at Norfolk, Virginia, reached 1.12 inches (28 mm) between September 1 and 3, and pressure fell to a modest 1,012 mb (29.9 inHg). Sustained winds were recorded at 28 mph (45 km/h), with only slightly higher gusts, although the Chesapeake Light unofficially reported gusts to near 50 mph (80 km/h). Damage in the area was minimal with the exception of beach erosion, and tides 2.5 feet (0.76 m) above normal triggered minor flooding.[12] Moderate rainfall, approaching or reaching 5 in (130 mm), fell across the southern Delmarva Peninsula.[13] Equally minor effects were felt in the Atlantic City, New Jersey, area, with comparable or even less significant reports of winds and rainfall and damages limited to coastal flooding and beach erosion. Since the adverse weather conditions fell on a portion of the Labor Day weekend, the local resort industry suffered economical losses.[14]
New England and Canada[edit]
The brunt of the storm occurred in southeastern New England, particularly coastal Massachusetts, where strong gusts battered the shore.[11] The distribution of winds resulting from the storm more closely resembled that of a nor'easter than a cyclone of tropical origin, in which the wind field would typically be concentrated closer to its center. Instead, the strongest winds remained well removed from the center of circulation, but were nonetheless severe; gusts reached 84 mph (135 km/h) at Point Judith, Rhode Island, and 69 mph (111 km/h) on Cape Cod, Massachusetts. Sustained winds throughout the region were generally below 50 mph (80 km/h). In Boston, Massachusetts, winds gusted to 46 mph (74 km/h). The storm brought down trees and powerlines, blocking roads and damaging property. Structural damage was also evident, especially to buildings under construction, and an entire cottage in Rockland, Maine, was blown off its foundation.[15]
Rainfall in southeastern New England was heavy, locally exceeding 10 in (250 mm). On the island of Martha's Vineyard, a storm total of 12.5 in (320 mm) was reported, the highest known precipitation sum resulting from Carrie. The most torrential rains were usually confined to within 70 mi (110 km) of the coast. The deluge swelled streams, inundated cellars, and washed out a railroad near Eagle Lake, Maine, derailing a train. Along the coast, rough surf caused beach erosion and swamped hundreds of small craft.[15] On September 3, choppy conditions forced the suspension of steamship services to and from the mainland and the islands of Martha's Vineyard and Nantucket. Thousands of tourists and seasonal residents became stranded on the islands, creating what officials described as a "logistical problem".[16]
During the height of the storm, around 20,000 Narragansett Electric Company customers lost power, with scattered power outages reported elsewhere throughout New England.[17]
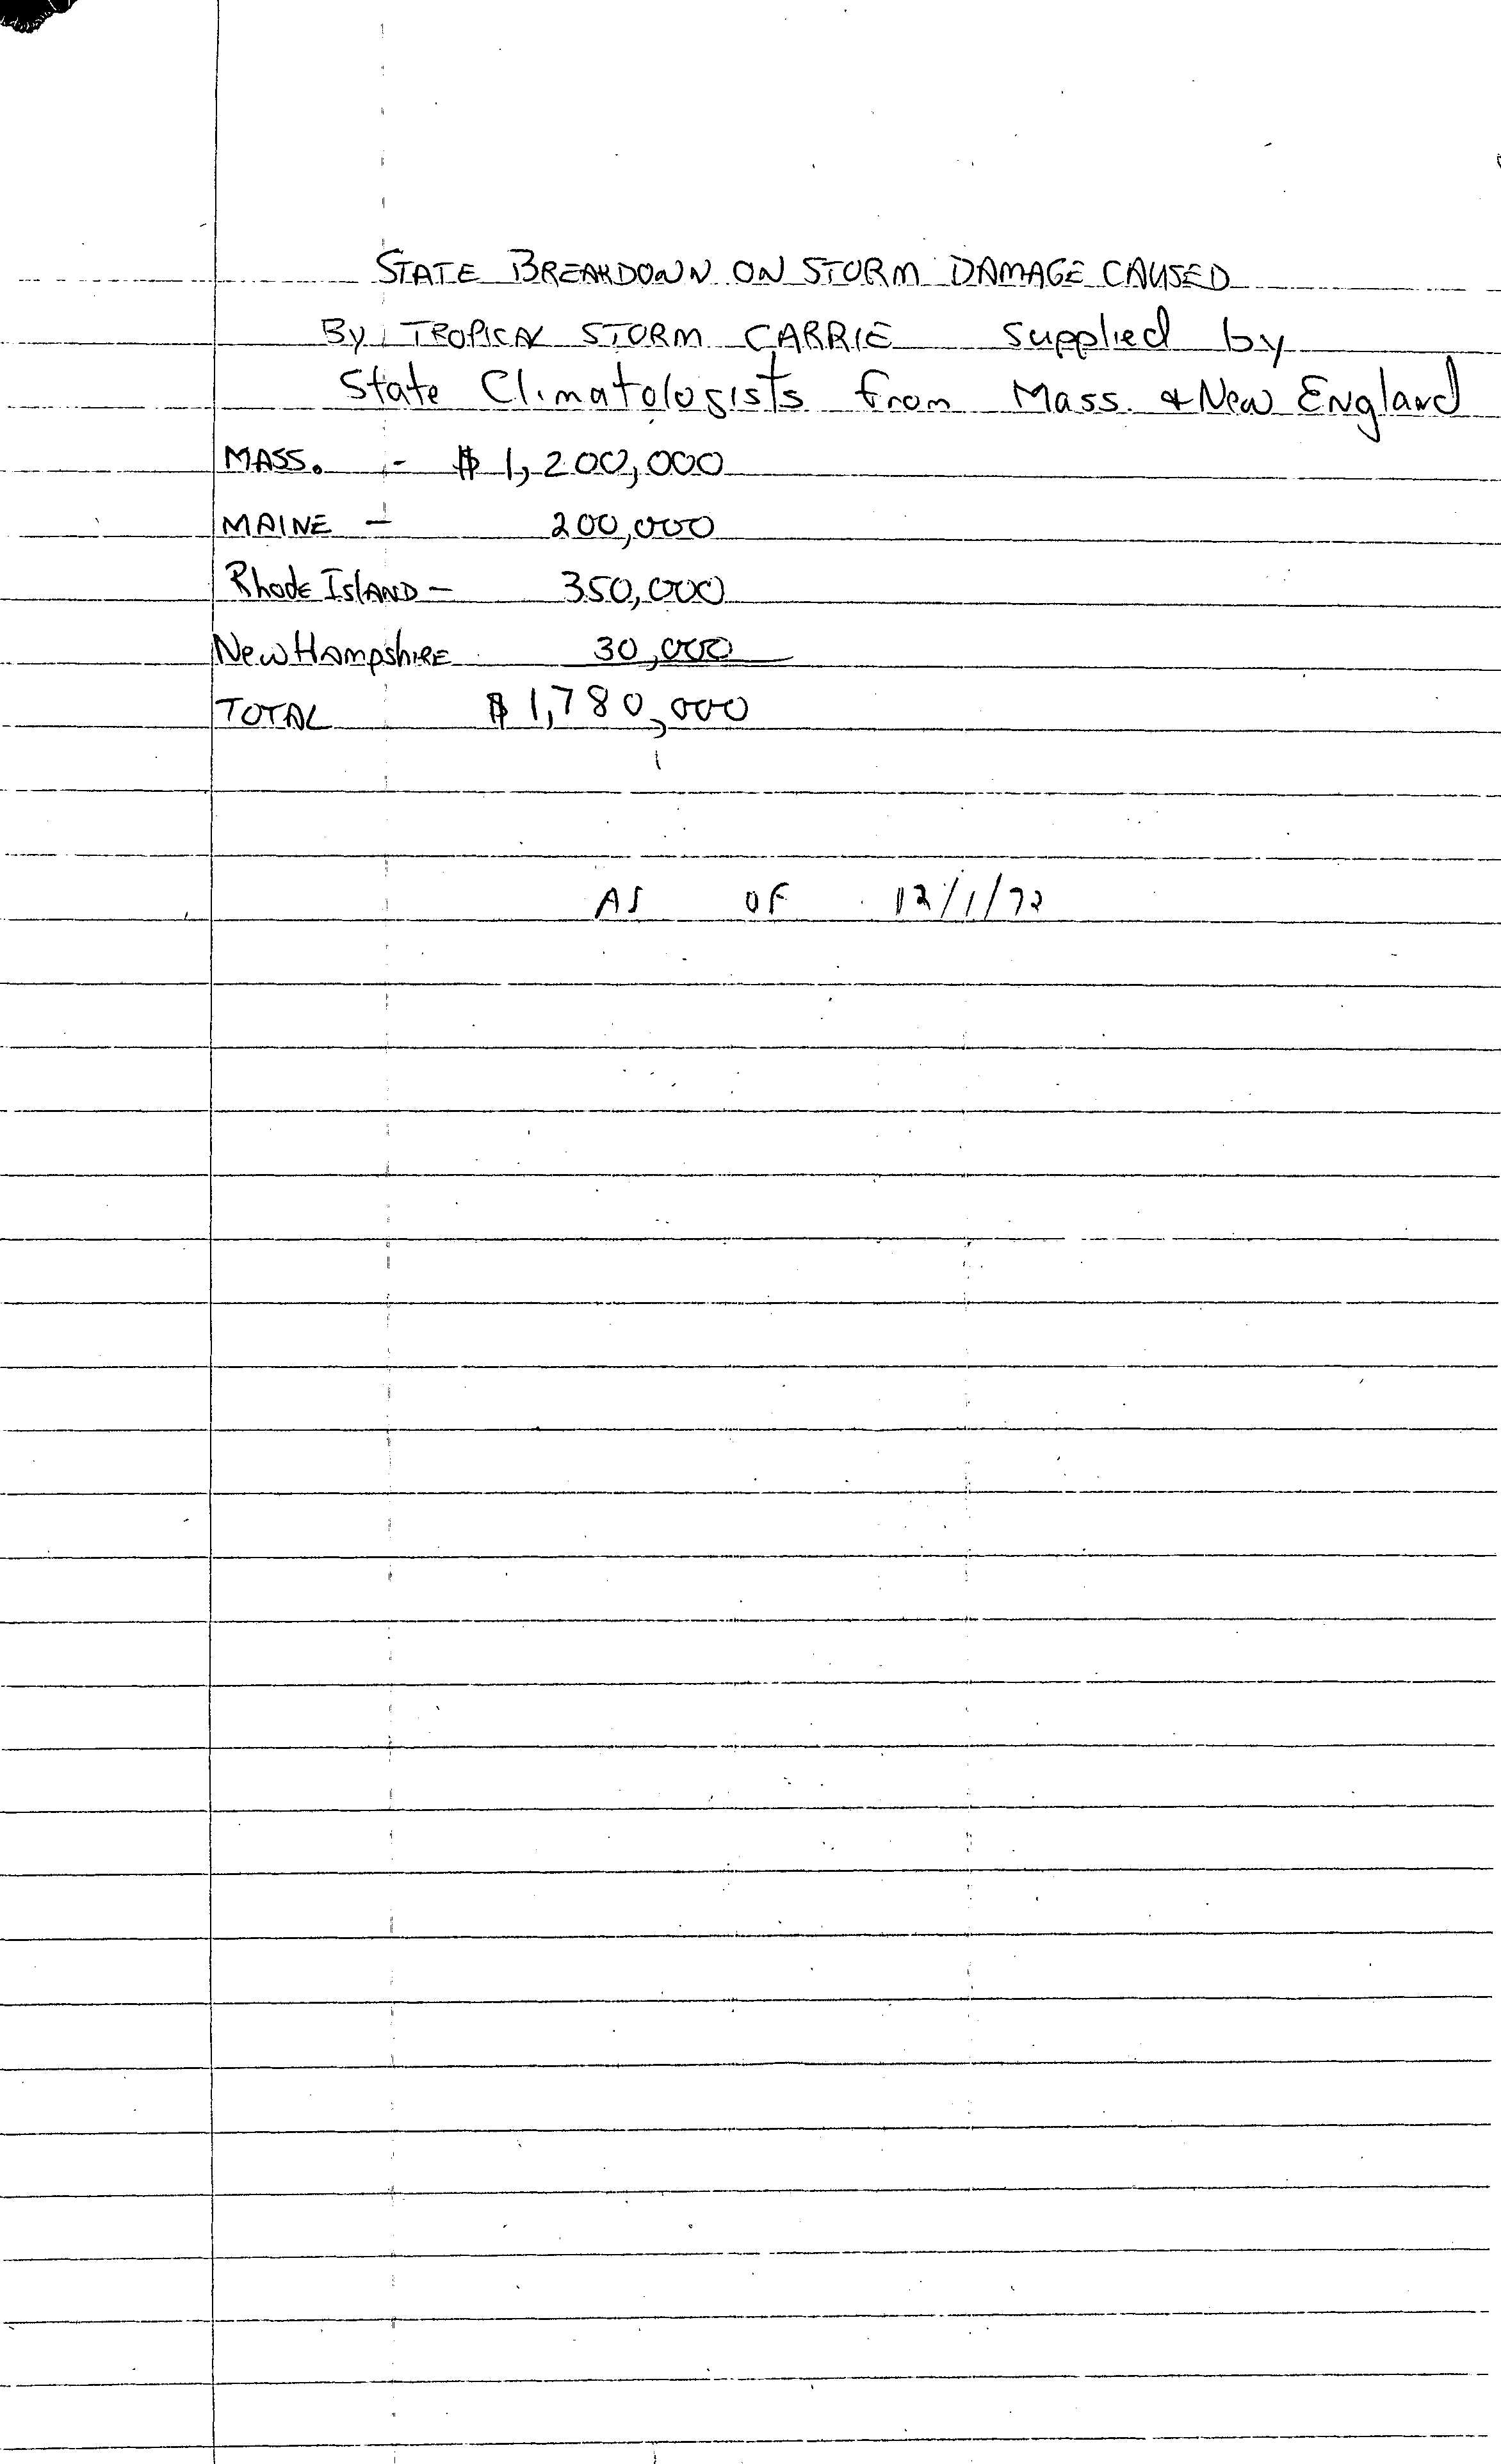
Damage from Tropical Storm Carrie and its extratropical remnants was light.[17] Total monetary damage was estimated at $1,780,000 (equivalent to $12,970,000 in 2023[18]), of which $1,200,000 in losses was inflicted on Massachusetts. Losses totaled $350,000 in Rhode Island, $200,000 in Maine, and $30,000 in New Hampshire.[19] Four fatalities were attributed to the storm: two in the aftermath of boating accidents in Massachusetts, and two due to rough surf along the coast of Maine. In the aftermath, a local disaster area was declared for the town of Plymouth.[15]
The weakening remnants of Carrie produced strong winds throughout New Brunswick on September 4. In Saint John, where wind gusts reached 97 km/h (60 mph), there were reports of downed telephone wires and trees. Widespread power outages occurred throughout communities in the province. Despite well over an inch of rain at Saint John, no flooding was evident. Fredericton also received fairly heavy rain and gusty wind on the 4th, which was its wettest day of the month but not its windiest. The storm damaged or destroyed numerous boats in Charlo, New Brunswick.[20][21][22]
Oceanic currents produced by the storm washed cells of the harmful alga Alexandrium fundyense south and west into the coastal waters of New England. The alga releases toxins that cause shellfish poisoning and is native to the Bay of Fundy. Several weeks after the storm, a massive bloom of the alga occurred offshore the northeastern United States for the first time, and the species bloomed every year post-Carrie.[23]
See also[edit]
- List of Canada hurricanes
- List of wettest tropical cyclones in the United States
- Timeline of the 1972 Atlantic hurricane season
References[edit]
- ^ a b c d e f g h Simpson, R.H. & Hebert, Paul J. (1973). "Atlantic Hurricane Season of 1972" (PDF). Monthly Weather Review. 101 (4). American Meteorological Society: 332. Bibcode:1973MWRv..101..323S. doi:10.1175/1520-0493(1973)101<0323:ahso>2.3.co;2. Retrieved July 13, 2011.
- ^ a b c d Hurricane Specialists Unit (2009). "Easy to Read HURDAT 1851–2008". National Hurricane Center. Retrieved July 13, 2011.
- ^ Simpson, Robert (August 31, 1972). "Tropical Storm Advisory Number 1 – Carrie". National Hurricane Center. Retrieved July 13, 2011.
- ^ Pelissier, Joe (September 1, 1972). "Tropical Cyclone Discussion – Storm Carrie". National Hurricane Center. Retrieved July 13, 2011.
- ^ Hebert, Paul (September 2, 1972). "Tropical Cyclone Discussion – Storm Carrie". National Hurricane Center. Retrieved July 13, 2011.
- ^ Pelissier, Joe (September 2, 1972). "Tropical Cyclone Discussion – Storm Carrie". National Hurricane Center. Retrieved July 13, 2011.
- ^ Pelissier, Joe (September 2, 1972). "Tropical Cyclone Discussion – Storm Carrie". National Hurricane Center. Retrieved July 13, 2011.
- ^ National Weather Service Washington (September 3, 1972). "Severe Weather Bulletin Number 2". National Hurricane Center. Retrieved July 13, 2011.
- ^ National Weather Service Washington (September 1, 1972). "Tropical Storm Advisory Number 5 – Carrie". National Hurricane Center. Retrieved July 13, 2011.
- ^ National Weather Service Washington (September 2, 1972). "Tropical Storm Advisory Number 9 – Carrie". National Hurricane Center. Retrieved July 13, 2011.
- ^ a b National Weather Service Boston (September 3, 1972). "Special Weather Bulletin Number 4". National Hurricane Center. Retrieved July 13, 2011.
- ^ a b Chapman, Dorothy (September 5, 1972). "Report on Tropical Storm Carrie". National Hurricane Center. Retrieved July 13, 2011.
- ^ Roth, David. "Tropical Storm Carrie - August 29-September 5, 1972". Hydrometeorological Prediction Center. Retrieved July 13, 2011.
- ^ Ross, Martin (September 6, 1972). "Report on Tropical Storm Carrie". National Hurricane Center. Retrieved July 13, 2011.
- ^ a b c National Climatic Center, United States Weather Bureau, Environmental Data Service (1972). Climatological data: National summary, Volume 23. United States Department of Commerce. p. 70. Retrieved July 14, 2011.
{{cite book}}: CS1 maint: multiple names: authors list (link) - ^ Staff Writer (September 4, 1972). "Vacationers Stranded". The Palm Beach Post. Archived from the original on July 11, 2012. Retrieved July 14, 2011.
- ^ a b Staff Writer (September 5, 1972). "Storm Moves On, Damage Is Light". Bangor Daily News. Retrieved July 14, 2011.
- ^ 1634–1699: McCusker, J. J. (1997). How Much Is That in Real Money? A Historical Price Index for Use as a Deflator of Money Values in the Economy of the United States: Addenda et Corrigenda (PDF). American Antiquarian Society. 1700–1799: McCusker, J. J. (1992). How Much Is That in Real Money? A Historical Price Index for Use as a Deflator of Money Values in the Economy of the United States (PDF). American Antiquarian Society. 1800–present: Federal Reserve Bank of Minneapolis. "Consumer Price Index (estimate) 1800–". Retrieved February 29, 2024.
- ^ "State Breakdown of Storm Damage Caused by Tropical Storm Carrie". National Hurricane Center. December 1, 1972. Retrieved July 14, 2011.
- ^ "1972 – Carrie". Canadian Hurricane Centre. Archived from the original on September 5, 2012. Retrieved July 14, 2011.
- ^ "Historical Data - Climate - Environment and Climate Change Canada". October 31, 2011.
- ^ "Historical Data - Climate - Environment and Climate Change Canada". October 31, 2011.
- ^ Anderson, Donald M (2004). "The Growing Problem of Harmful Algae". Woods Hole Oceanographic Institution. Retrieved July 14, 2011.
Tropical cyclones of the 1972 Atlantic hurricane season | ||
|---|---|---|
 | ||